
AgencyGraph: see where your estate agency stands against every competitor
AgencyGraph went live for Spain and Portugal on 31 October 2026 on the REST API and as an MCP server for Claude, Cursor and other MCP clients. Built by CASAFARI, the property data layer for estate agents and their AI assistants, AgencyGraph covers about 41,000 agencies and offices with homes for sale in 4,767 Spanish towns and about 17,600 in 309 Portuguese towns (weekly build, October 2026). It benchmarks local competitors on inventory, asking price discipline, market share and branch networks every week. Italy, Germany, Austria, Poland and Greece come next, then France, Belgium and Luxembourg. Start a 30-day free trial with 1,000 tokens (no card required) when you sign in on platform.casafari.com.
Why has estate agency market share been so hard to read until now?
Measuring true market share in estate agency has historically been notoriously unreliable. In Spain and Portugal, the same home for sale is frequently advertised by several agencies across multiple portals and individual agency websites. Furthermore, portal advertisements feature inconsistent agency spellings, regional branch name variations, and fragmenting network identities. Measuring estate agency competitor performance based on raw advertisements invariably leads to double-counting and skewed metrics.
CASAFARI solves this structural challenge through indexing, cleaning and deduplication models that process property advertisements across portals and agency websites. Multiple advertisements for the same property are combined into a single, unified property record with a complete event timeline, tracking when a home is listed, when its asking price changes, when it is delisted, and when it is relisted. AgencyGraph then resolves the various name spellings and branch identifiers, attributing each deduplicated property and event to its correct agency entity, local branch office, and overarching network.
By converting raw online advertisements into clean property records, AgencyGraph creates an objective, town-by-town digital inventory index. Agency principals and network directors can instantly understand true portfolio sizes and stock movement without manual spreadsheets or anecdotal guesswork. You can test these capabilities immediately on the platform or connect the AgencyGraph MCP server directly to Claude, Cursor or another MCP client to query your market share using natural language.
What does AgencyGraph measure for estate agent competitor analysis?
To conduct rigorous estate agent competitor analysis, AgencyGraph establishes five core inventory pillars per agency and per town. The system evaluates every agency with 5 or more homes for sale—encompassing about 22,000 agencies in Spain and 6,600 in Portugal as of October 2026. All price metrics in AgencyGraph are derived strictly from asking prices in indexed property advertisements, never closing prices.
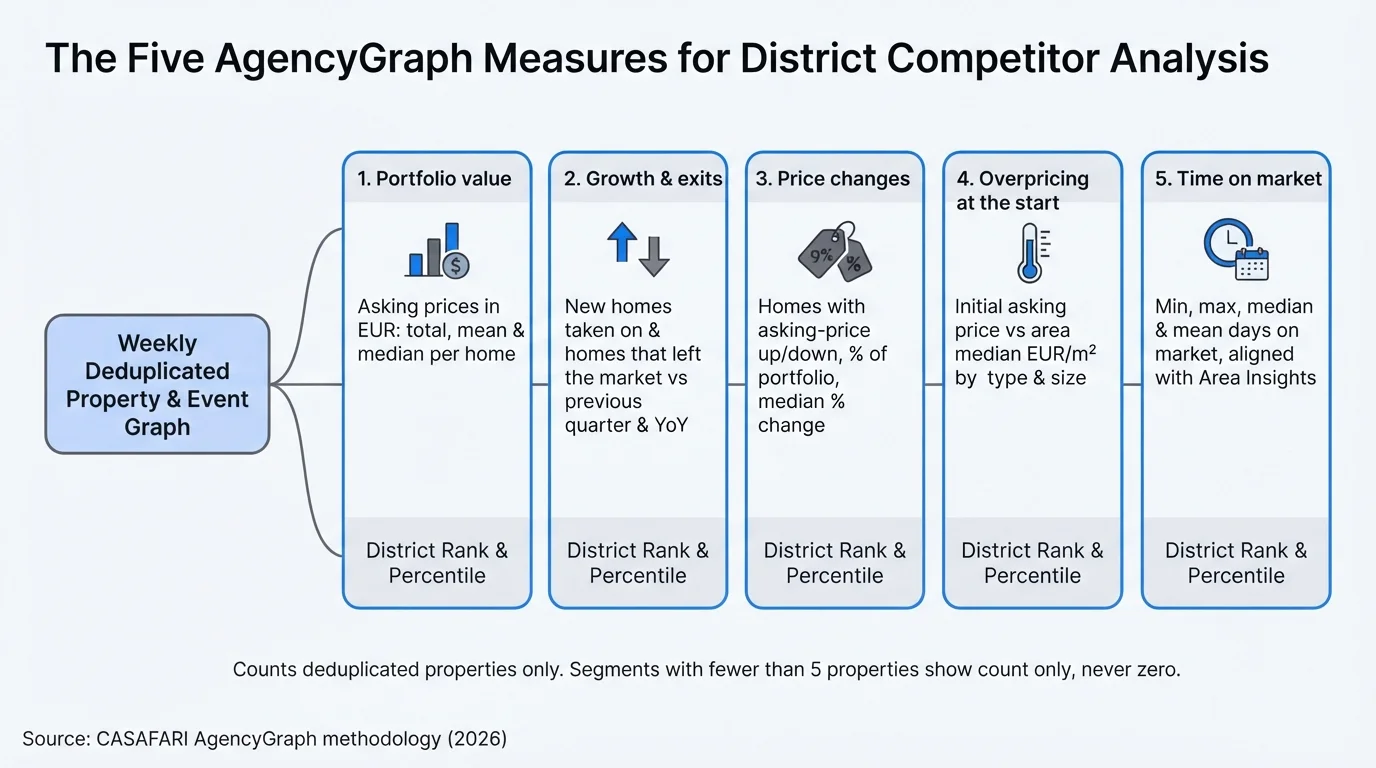
- Portfolio value: Calculates total, mean, median, minimum, maximum, and quartile asking prices in Euros, alongside the median asking price per square metre for each agency’s active residential stock.
- Growth: Tracks new and withdrawn homes in the latest complete quarter, comparing quarter-on-quarter and year-on-year expansion.
- Asking price cuts and increases: Identifies the precise number and percentage of properties experiencing asking price revisions, measuring the median percentage size of cuts and increases.
- Overpricing at the start: Measures the median gap between an agency’s initial asking prices per square metre and the town’s median, indicating the share of homes launched more than 10% above market median and how many were subsequently discounted.
- Time on the market: Computes the minimum, maximum, median, and mean days active on the market across the agency’s portfolio.
Each agency profile provides the firm’s percentile and rank against local rivals in that specific town, while town benchmarks allow sorting by any chosen measure. There is no synthetic composite score; AgencyGraph measures what agencies advertise online, as CASAFARI’s index sees it. Furthermore, users can maintain a custom watchlist of up to 25 agencies—tracking inventory changes, asking price adjustments, and branch mergers week by week for 25 tokens per query.
Features coming to AgencyGraph
The following capabilities are coming to the same tools, at no extra price; no dates promised:
- Exclusivity and portal mix: Observed stock exclusivity and distribution across portals and agency websites.
- Specialisation: Portfolio breakdown across luxury homes, new builds, commercial properties, rental management and foreign-buyer targeting.
- Listing quality: Listing presentation standards, photo counts, description depth and energy certificate indicators.
- Tech stack and online presence: CRM and website vendor, social media profiles and Google advertising presence.
- MLS membership: Verified and likely participation in local multiple listing services.
For broader macro trends across municipal markets, agency owners complement these firm-level metrics with market-wide analytics from Area Insights. You can review every tool, price and measure on the AgencyGraph capabilities page (in English).
Do AI assistants recommend estate agents, and where do their answers come from?
In 150 Spanish and Portuguese towns, only about 7–13% of the sources AI assistants cite are an agency’s own website; about 35% are portals (CASAFARI GEO study, October 2026, 1,199 questions).
To help agencies monitor and optimize how answer engines read their brand, AgencyGraph will incorporate SEO, AEO and GEO AI search visibility scores into the same tools, at no extra price.
For more background on competitor benchmarking workflows, read our guide on monitoring your real estate competitors with CASAFARI.
How does the method keep every comparison fair and transparent?
AgencyGraph is built on a digital inventory index methodology. It measures what estate agency firms publicly advertise online as captured by CASAFARI’s index—not internal sales revenues, off-market transactions, or subjective client service quality.
Because co-listed properties advertised by multiple agencies are correctly attributed to each participating firm, total market shares within a town can sum to more than 100%. Private individual sellers, banking entities, property developers, and raw MLS feeds are filtered out, ensuring comparisons remain strictly between professional estate agencies. AgencyGraph resolves firm entities (agencies, independent offices, network branches) and explicitly excludes individual agent names, personal phone numbers, or private email addresses. If you need coverage that includes individual agent profiles in Germany, explore AgentGraph AI for agencies and individual agents in Germany.
To maintain computational integrity, AgencyGraph says “not known” rather than guessing; a town or agency with fewer than 5 homes shows its count without figures. Unreadable websites or missing office addresses return unverified or missing statuses rather than assumed zero scores. If an agency identifies an inaccurate spelling, missing office, or split entry, it can submit a request on our AgencyGraph corrections page or email support@casafari.com detailing its corporate name and website. CASAFARI answers requests within 10 working days and applies updates in the subsequent weekly build. Complete technical details are available in the AgencyGraph developer documentation.
Prompts to query AgencyGraph with Claude and AI assistants
You can query AgencyGraph through the AgencyGraph MCP server in Claude, Cursor and other MCP clients (server address https://platform.casafari.com/mcp/agencygraph). Explore MCP recipes for AI agents, browse our sample reports index (in English), or try these prompts:
- Agency owners benchmarking local standing: See sample reports for where your agency stands in Málaga (in English) and how to win the mandate in Cascais (in English).
“Rank the real estate agencies in Málaga by homes for sale, with their price cuts and median days on market, and show where my agency sits.” Tools used:
agencygraph_area_benchmark(75 tokens a page of 25 agencies),agencygraph_agency_profile(50 tokens). - Franchise networks recruiting prospective partners: See sample reports for recruiting across five Spanish cities (in English) and identifying network gaps in five Portuguese towns (in English).
“Find independent agencies in Valencia province with 30 to 150 homes for sale that grew this quarter and cut prices less than the town’s median.” Tools used:
agencygraph_screen_agencies(100 tokens a page of 25 matches),agencygraph_territory(50 tokens). - Banks, developers and investors choosing agency partners: See the sample report on choosing an agency in Barcelona (in English).
“Which agencies in Marbella move houses off the market fastest, with the least overpricing at start, among those with at least 40 homes for sale?” Tools used:
agencygraph_area_benchmark(75 tokens),agencygraph_screen_agencies(100 tokens).
Proptech vendors can also target prospective clients using our estate agency database for software sales (see a sample vendor prospect list for Lisbon and Porto, in English), while portals can conduct commercial account reviews using our property portals agency coverage guide.
Developers and data teams can access endpoints via REST API or connect directly through the MCP server. Sign up for a free 30-day trial with 1,000 tokens (no credit card required) when you sign in on platform.casafari.com. Individual queries cost 5 to 100 tokens (for example, 50 tokens or €2 per agency profile, 75 tokens or €3 for town benchmarks, and 100 tokens or €4 for agency screening). City datasets cost 2,500 to 12,500 tokens (€100 to €500) per year.
Frequently asked questions
How do I compare my estate agency against local competitors?
CASAFARI AgencyGraph benchmarks every estate agency with 5 or more homes for sale across Spain and Portugal against its town competitors. The platform ranks firms across five live asking-price inventory metrics: portfolio value, quarterly stock growth, price cut frequency, starting overpricing, and days on market. You can also monitor up to 25 chosen competitors on a weekly watchlist for 25 tokens per query, with tech stack and AI visibility metrics coming to the same tools at no extra price.
Do AI assistants recommend estate agents from their own websites or portals?
In 150 Spanish and Portuguese towns, only about 7–13% of the sources AI assistants cite are an agency’s own website; about 35% are portals (CASAFARI GEO study, October 2026, 1,199 questions). AgencyGraph will incorporate SEO, AEO and GEO AI search visibility scores into the same tools as a coming feature at no extra price.
What does CASAFARI AgencyGraph measure for each estate agency?
AgencyGraph is a weekly estate agency database covering about 41,000 agencies and offices with homes for sale in 4,767 Spanish towns and about 17,600 in 309 Portuguese towns (weekly build, October 2026). For firms with 5 or more homes for sale, it measures asking-price portfolio value, quarterly stock growth, asking price changes, overpricing at the start, and time on the market. Advanced signals such as tech stack, listing quality and AI visibility scores are coming to the same tools at no extra price.
How is AgencyGraph different from AgentGraph?
AgencyGraph focuses exclusively on firm-level entities—agencies, branch offices, and network groups—and is live in Spain and Portugal, while Italy, Germany, Austria, Poland and Greece come next, then France, Belgium and Luxembourg. AgentGraph is a separate product operating in Germany that profiles both agencies and individual estate agents.
How can an estate agency correct its profile in AgencyGraph?
If an agency detects an error in its entity profile, branch mapping, or website attribution, it can request a correction on the AgencyGraph corrections page or by emailing support@casafari.com with its business name and official website URL. CASAFARI answers requests within 10 working days, and approved updates are applied in the following weekly build.