
Property developers: plan, price and sell a scheme on evidence
Property developers use CASAFARI's deduplicated property graph to underwrite land acquisitions, test neighbourhood absorption, price schedules of accommodation, and protect scheme sales velocity. By accessing live listing histories across web, REST API, or AI workflows, development teams remove guesswork from residual valuations and investment committee proposals. <!-- visual: developer-lifecycle-workflow -->
How do you source commercial plots and underwrite land with clean comparables?
Securing viable development land requires clear site intelligence and defensible exit assumptions before committing equity or debt. Land buyers and development directors need precise comparative evidence to substantiate residual land models at investment committee.
For commercial developments in Germany, land acquisition teams use Claro AI tools such as search_plots (POST /v1/claro/plots/search) and get_plot (GET /v1/claro/plots/{id}). According to the CASAFARI Developer Documentation (October 2026), this dedicated dataset isolates commercial land without mixing in existing premises counts, returning zoning allowances, extracted text facts, and listing agency contacts. To learn more about location scoring, read our guide on site selection in Spain and Germany with Claro AI.
Across European markets, acquisition teams validate scheme exit values using Comparables and property valuation tools. By filtering for urban_plot or rural_plot with specific plot_area criteria, or setting condition to new for completed stock, developers establish robust benchmark pricing. As detailed in the developer guide on valuing plots and new homes with Comparables, all CASAFARI figures track deduplicated asking prices and historical portal revisions across time.
Is local demand absorbing new supply, or are you building into a buyer's market?
Committing to construction financing without confirming local market liquidity risks prolonged holding costs. National or municipal market averages frequently mask micro-location oversupply in specific postcodes.
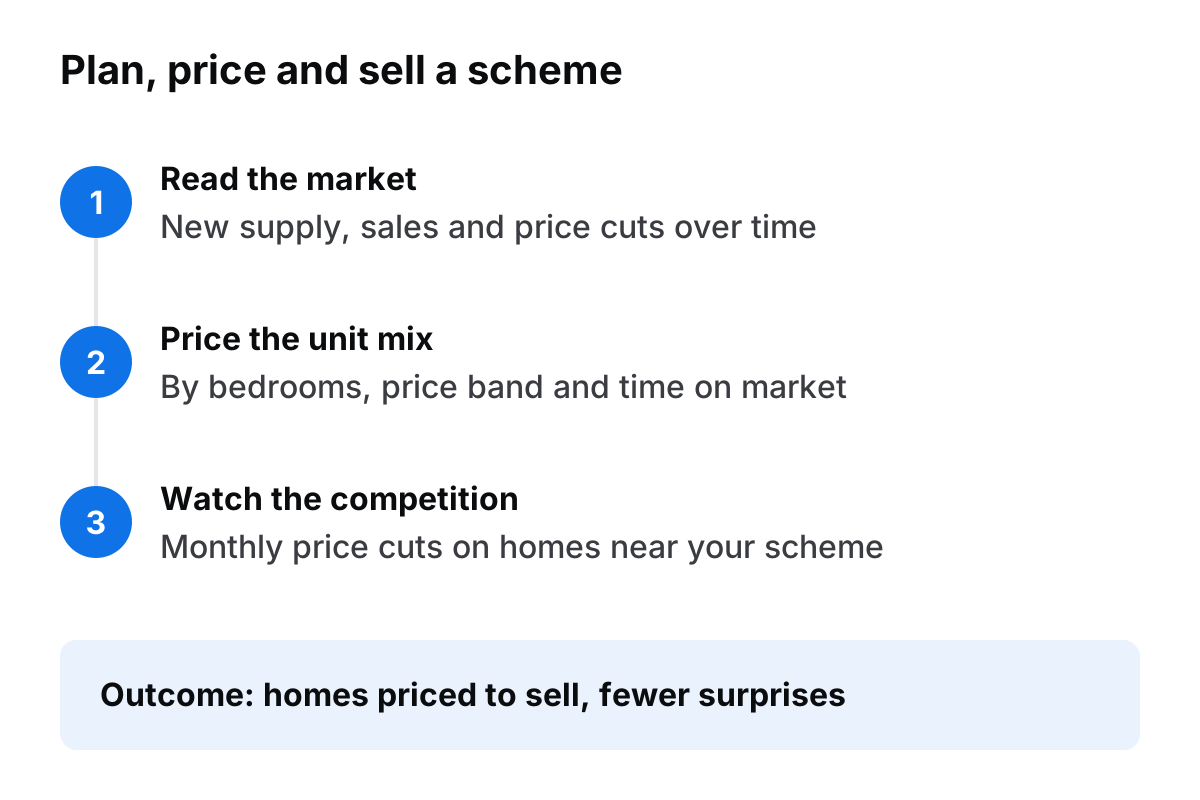
Development managers verify local absorption using Area Insights market analytics. The platform evaluates market activity across five synchronised time-series metrics: new, sold_or_rented, available_on_market, price_up, and price_down. As explained in the documentation for measuring supply and demand in an area (October 2026), when newly listed stock consistently exceeds sold_or_rented properties alongside a higher volume of price reductions than price increases, the micro-market is shifting toward a buyer's market. Feasibility models must adjust absorption rates accordingly.
How do you calibrate unit mix and price bands so units sell faster?
Designing a successful scheme requires structuring the unit mix—balancing one-, two-, and three-bedroom homes—within the price brackets where active buyer demand is most liquid.
Teams combine three structural distributions within Area Insights to calibrate unit schedules:
- Bedrooms distribution (
area-insights_get_bedrooms_distribution): Returnsproperties_countandaverage_price_per_sqmacross bedroom tiers, benchmarking planned layouts against active competing stock. - Price distribution (
area-insights_get_price_distribution): Identifies where active listings cluster and highlights the average market price tier (is_mean: true). - Time on market distribution (
area-insights_get_time_on_market_distribution): Details averagedays_on_marketandmonths_on_marketper price band.
As documented in the guide on pricing a unit mix by bedrooms and price bands (October 2026) and analysing time on market by price band (October 2026), targeting price bands with the lowest days on market ensures schemes maintain swift sales velocity upon release.
How do you monitor competing homes cutting prices around your active scheme?
Maintaining sales momentum during active marketing requires continuous visibility over nearby competing listings. Unplanned price cuts by neighbouring developments can quieten show-home footfall if left unmonitored.
Sales directors implement a monthly stale-stock monitor using High Potential Seller Leads (GET /v1/seller-leads). By querying a 300-metre radius around an active site for properties with at least one price reduction (min_price_cuts=1) over the past 30 days, teams receive clear intelligence. Based on the developer documentation for setting up a monthly stale-stock monitor around a development (October 2026), this workflow is active across Spain, France, Italy, Germany, Greece, and Andorra (with Property Sourcing covering Portugal).
Each monthly report reveals the count of price-reduced competing properties and their average percentage discount (price_cuts.percentage). On-site sales teams can address buyer price objections with direct market evidence rather than speculative discounts.
How do you automate a monthly local market report for your investment committee?
Preparing monthly investment committee updates or lender compliance reports traditionally requires manual portal monitoring and fragmented spreadsheet updates.
Development analysts streamline this process using a 13-call Area Insights sequence, executed via REST API or through Casafari MCP for AI agents within Claude, ChatGPT, Cursor, or Gemini CLI. As outlined in the guide on building an automated monthly local market report (October 2026), the sequence anchors the target boundary via Location Lookup, fetches price per square metre trends (delta_pct, yoy_last, cagr), extracts supply and absorption metrics, generates bedroom and price distributions, and compiles sub-area heatmaps into a single, audit-ready packet.
How to start with CASAFARI
Development teams access CASAFARI's property intelligence through the web application, direct REST API endpoints, or via Casafari MCP inside AI agent environments. Cross-border growth teams can also explore CASAFARI for Business Expansion to evaluate new target markets.
Start immediately on the Free plan with 1,000 tokens for 30 days (no credit card required), or upgrade to the Agent plan at EUR 70 per month (or EUR 49 per month billed annually). Detailed token usage and Custom tier specifications are available in the token plans and Custom tiers documentation.
To explore the datasets and start underwriting schemes with real-time market evidence, sign in to the CASAFARI platform.
Frequently asked questions
How do property developers check local supply and absorption before acquiring land?
Developers evaluate Area Insights time series for five core activity metrics: new listings, properties marked sold or rented, total available market stock, price increases, and price reductions. When new listing counts outpace sold or rented units alongside rising price reductions, local supply is building and absorption is slowing. This signals a buyer's market where conservative absorption timelines must be underwritten.
How can developers price a residential unit mix using bedroom and price-band distributions?
Teams query three Area Insights endpoints across the target scheme boundary: bedroom distribution, price distribution, and time on market distribution. Bedroom distribution supplies average price per square metre and property counts per bedroom tier to align with planned schedules of accommodation. Cross-referencing these figures with time on market distributions highlights the exact price bands experiencing the lowest average days on market and highest transaction liquidity.
Where can commercial developers find development plots in Germany?
Commercial developers use Claro AI tools search_plots and get_plot to search dedicated German commercial plot listings. This specialized dataset isolates commercial plots from general commercial premises, delivering extracted zoning information, site dimensions, and direct agency contact details. Technical specifications can be reviewed in the developer documentation.
How do developers track competing homes cutting asking prices around an active scheme?
Sales directors run a monthly stale-stock query via High Potential Seller Leads across a 300-metre radius around an active site. Filtering for competing properties with at least one price cut in the previous 30 days returns the total count of discounting properties and their average percentage price reduction. This capability covers Spain, France, Italy, Germany, Greece, and Andorra, while Property Sourcing delivers comparative tracking in Portugal.
Which European countries does CASAFARI cover for property development analysis?
CASAFARI's deduplicated property graph covers 14 countries in Europe (Andorra, Austria, Belgium, Switzerland, Germany, Spain, France, Greece, Italy, Luxembourg, Monaco, Poland, Portugal, and San Marino), the United Arab Emirates, and is entering the US now in selected states for commercial real estate only via Claro AI. Asking-price metrics use deduplicated asking prices and full portal price histories; valuations can also draw on closing prices from official open data, notaries and client-reported transactions.
See it on your own market
1,000 free tokens for 30 days, no card. Then the Agent plan or prepaid tokens.