
Why identifying trends in real estate is so important and how to do it with CASAFARI
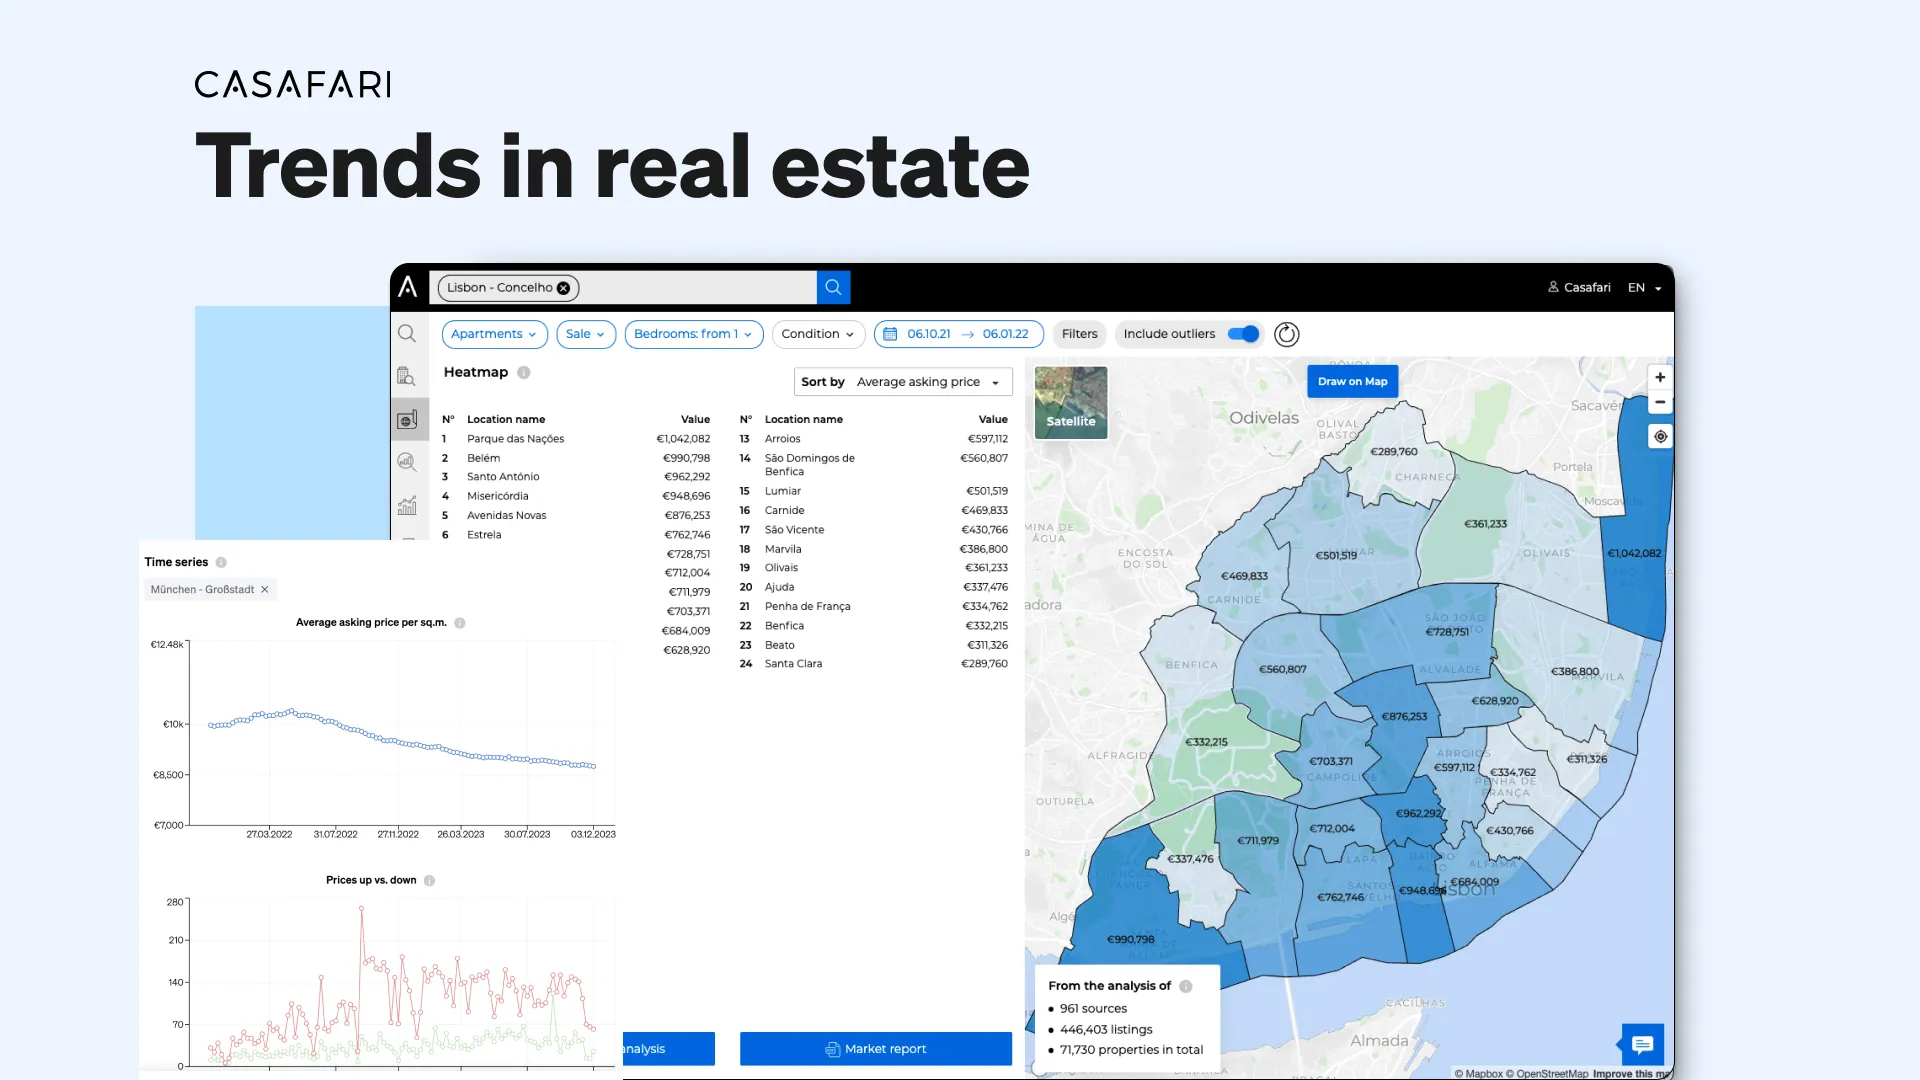
Identifying real estate trends allows estate agents and brokers to adapt marketing and services, mitigate market risks, gain a competitive edge, build client trust, and diversify offerings. Professionals track asking prices and supply over time across locations using CASAFARI’s time series, heatmaps, and market reports to navigate property dynamics with data-driven confidence.
Why should real estate professionals monitor market trends?
Working with market insight
Starting with the most obvious conclusion, trends provide valuable insights into the direction of the market, such as price fluctuations, demand patterns, and emerging neighbourhoods. This knowledge helps estate agents advise clients accurately and strategise their work according to the reality of the market.
Adopting risk mitigation strategies
While some trends can be used to grow your portfolio, others can be perceived as a threat to the way your business works today or to your clients, such as market saturation or fluctuating interest rates. Identifying potential risks associated with real estate trends enables professionals to mitigate them and protect their clients’ investments.
Granting a competitive edge
By being aware of trends in real estate, professionals such as brokers can anticipate market shifts, for example, by expanding their business at the right time or to the right area. Estate agents, on the other hand, may take advantage of this knowledge to position themselves as experts in the industry.
Building client trust
Clients tend to trust professionals who demonstrate a strong understanding of the market. By keeping up with real estate trends and showing they’re knowledgeable, professionals can win the trust of clients, developing long-term relationships and winning future referrals.
Diversification of Services
Understanding trends in real estate helps professionals diversify their services, offering innovative solutions, going after new technology to boost their work and specialising in niches that are rising.
How can you track real estate trends with CASAFARI?
Time series: watching trends through time
Analysing a time series enables the identification of cyclical, seasonal, or long-term trends, aiding in making informed predictions and strategic decisions. This helps in understanding market dynamics, foreseeing potential shifts and adapting strategies accordingly, ultimately empowering professionals to navigate the real estate landscape with foresight and agility.
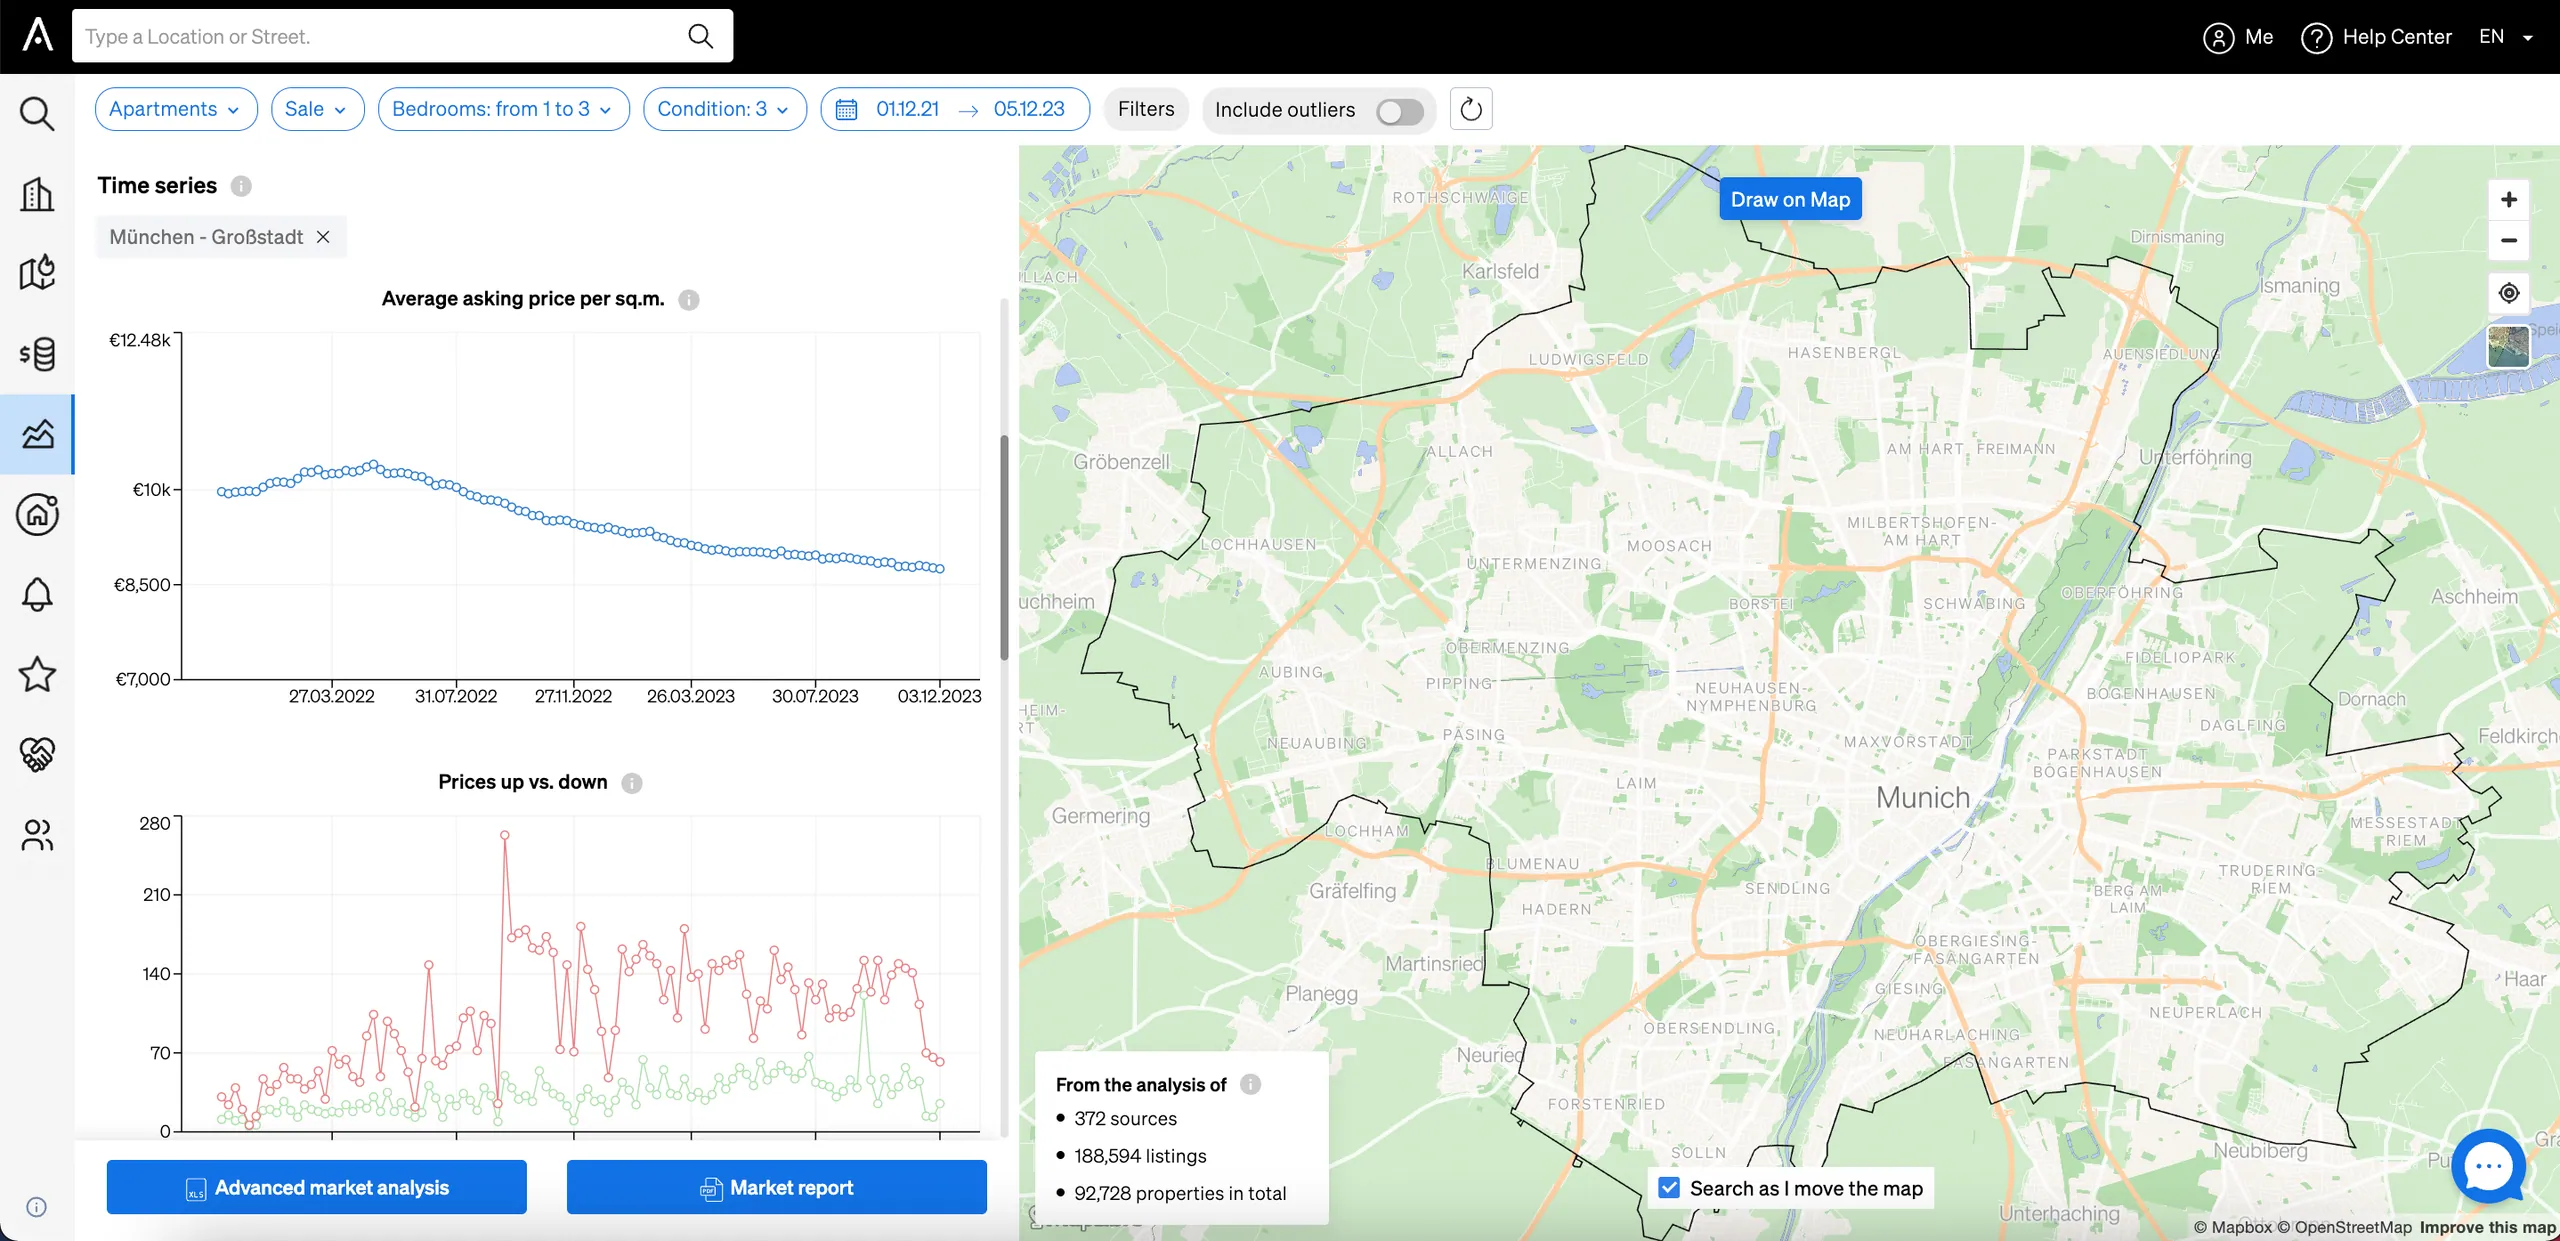
Inside CASAFARI Area Insights and Market Analytics, you can find a time series section in which you’ll see:
- The average asking price and average asking price per square metre;
- Increases and decreases of asking prices;
- New, sold and delisted properties on the market.
All the information can be seen for different kinds of properties (apartments, houses, plots, etc.), for sale or rent, for different typologies and characteristics, in a defined period of time or integrated via the Area Insights API documentation.
CASAFARI Market Analytics: follow the property market trends
Heatmap: a magnifying glass for localised trends in real estate
If you wish to better understand how the price vs. demand dynamic works in a specific area, CASAFARI’s Market Analytics provides you with a heatmap section that does exactly that.
You just need to set location, a period of time and define whether you want to see information of properties for sale or rent. The data will be exhibited on a map and through a list, with the option of sorting by:
- Average asking price;
- Average asking price per square metre;
- Number of properties available on the market;
- Prices up and down.
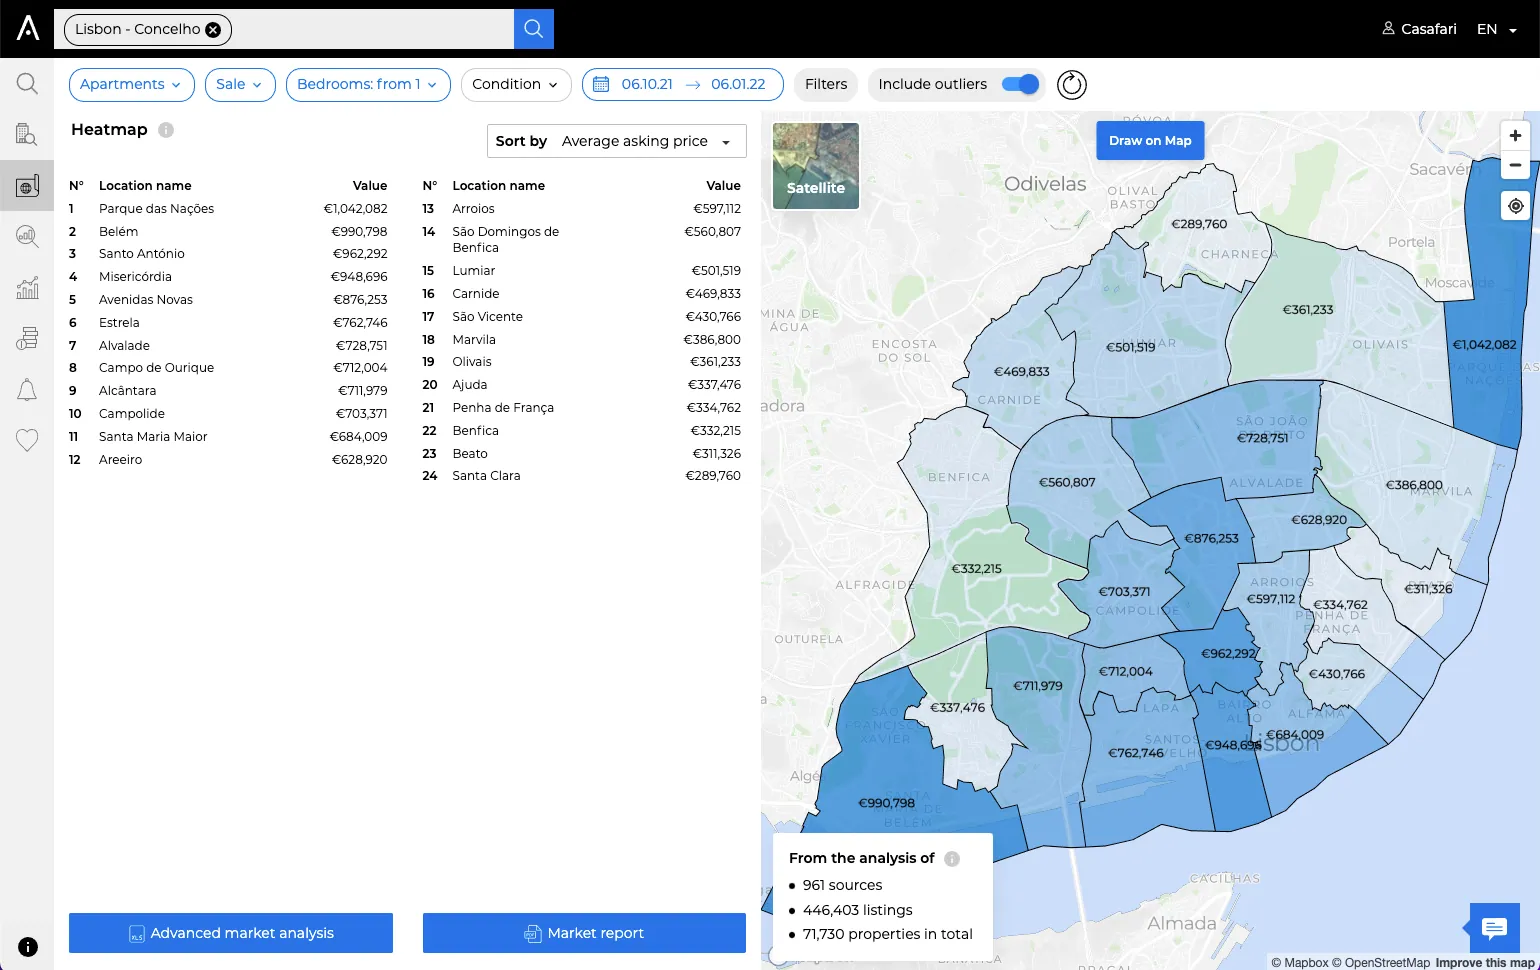
All the information is shown according to the typology and characteristics set by you, so you can see how the market reacts to a multitude of properties, for different clients’ needs.
Being a local expert as an estate agent: how CASAFARI helps you
Market reports, a deep-dive into a market
Whether you’re a broker thinking about expanding your real estate business to a new area or an estate agent that needs to have a keen understanding of parts of the city, CASAFARI has a solution to help you with the task.
Our Benchmarking and Properties market reports can help you:
- conduct research on competitors’ portfolio and year-over-year growth;
- understand demand levels per typology;
- assess market size and value;
- identify trends in real estate prices;
- calculate expected revenues;
- capitalise on emerging markets.
You can access these statistics and custom reports directly on platform.casafari.com.
CASAFARI’s Market Reports: the way to data-driven decisions
In conclusion, the role of identifying and understanding trends in real estate is indispensable for professionals who wish to offer tailored guidance, adapt swiftly to changing market conditions, and maintain a competitive edge in an evolving industry.
Embracing real estate trends isn’t merely a choice, it defines success and resilience in the ever-shifting world of property transactions and CASAFARI can help you tackle this challenge.
Frequently asked questions
Why is tracking property market trends important for estate agents and brokers?
Tracking property market trends provides key insights into price fluctuations and demand patterns, allowing agents and brokers to accurately advise clients. It enables professionals to mitigate risks such as market saturation or shifting interest rates while securing a competitive edge for expansion. Furthermore, understanding market dynamics builds client trust and guides the diversification of services toward high-growth niches.
What data does CASAFARI’s time series tool show?
CASAFARI’s time series tool tracks average asking prices and average asking prices per square metre across defined timeframes. It displays price increases and decreases alongside property counts for new, sold, and delisted listings. Professionals can filter this data by property type, typology, transaction type, and specific characteristics.
How does the heatmap in CASAFARI help analyse local property markets?
The heatmap allows real estate professionals to analyse localised price and demand dynamics by selecting a location, timeframe, and sale or rental transaction type. Data is displayed on an interactive map and list view, filtered by property typology and features. Users can sort neighbourhoods by average asking price, average asking price per square metre, available stock, and price movements.
What information is included in CASAFARI’s market reports?
Benchmarking and Properties market reports offer an in-depth analysis of specific property markets and regional performance. They detail competitor portfolios, year-over-year growth, demand levels across typologies, total market size, and asking-price trends. These reports help professionals evaluate expected revenues and identify emerging growth areas.
Can developers access CASAFARI’s market trend data via an API?
Yes, developers can integrate market trend data directly into their own applications using the Area Insights API. This service provides programmatic access to neighbourhood-level statistics, price distributions, and time series data. Full technical documentation is available on developers.casafari.com, and accounts can be managed via platform.casafari.com.