On the property market, data serves as a compass, providing valuable insights into the ever-changing trends and patterns that shape the industry. By analysing market data, businesses can make informed predictions about future movements, enabling them to proactively adapt strategies and stay ahead of the competition.
Whether it’s consumer preferences, economic indicators, or competitor behaviour, the wealth of information equips businesses with the knowledge needed to make sound decisions, identify emerging opportunities and potential threats. This proactive approach not only keeps businesses thriving but also safeguards the interests of clients.
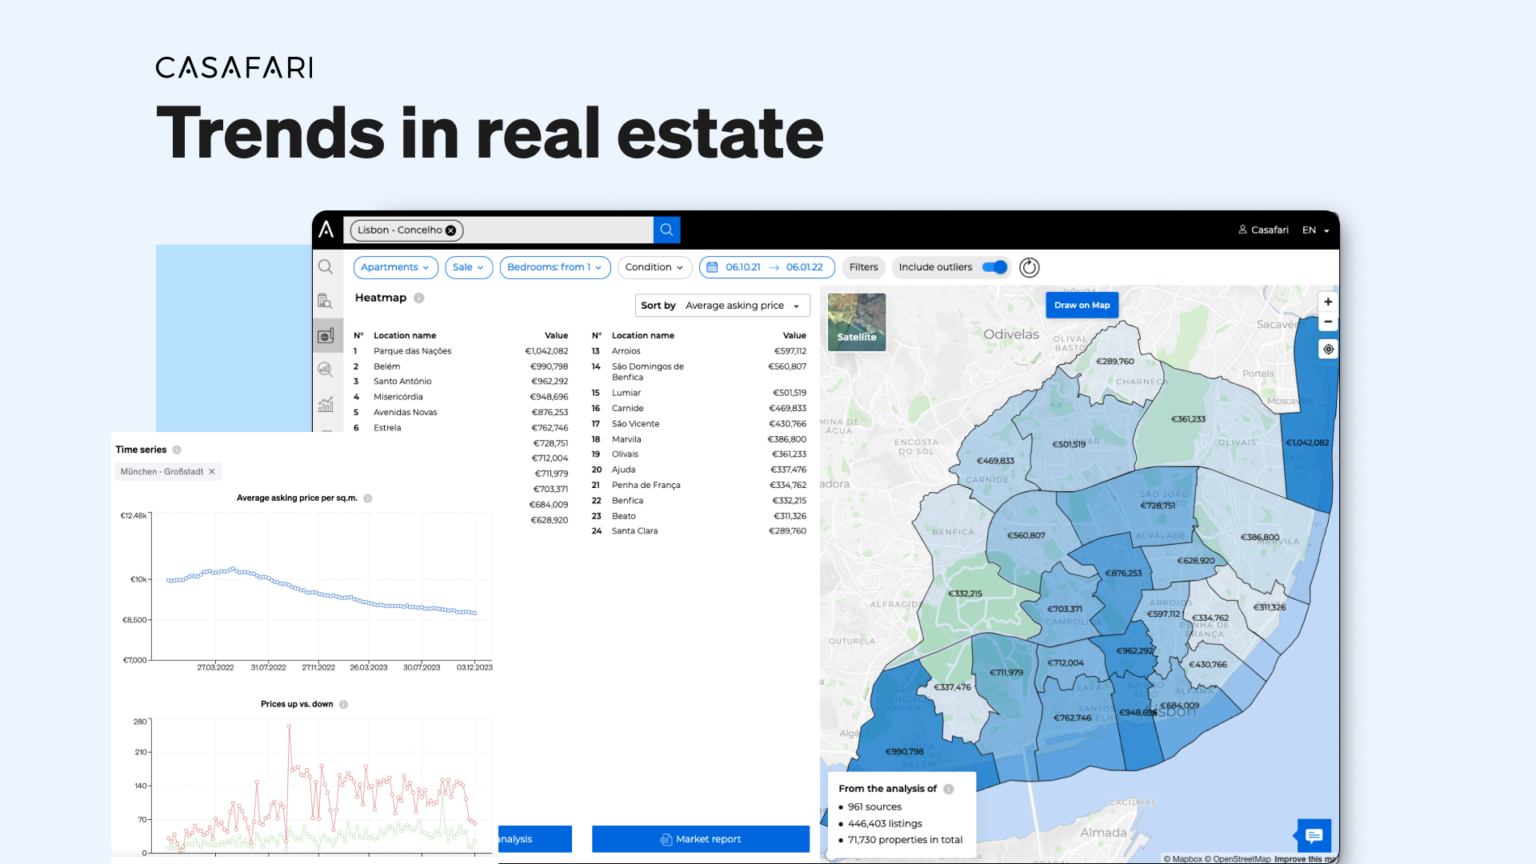
And to help with your strategic decision-making, CASAFARI’s Market Analytics harnesses the wealth of past and current data to facilitate precise property market predictions. Let’s see how you can use it in your business.
What is Market Analytics and how does it help with property market predictions?
Market Analytics is a powerful tool that analyses historical behaviours and trends, enabling users to identify patterns and make informed projections about future market movements.
This sophisticated platform empowers real estate professionals and investors with the actionable insights needed for informed decision-making on topics such as market stock, the evolution of property prices, as well as the time each type of asset spends on the market.
This is all done in a hyper-localised and niched way, allowing you to filter your research according to:
- specific markets;
- specific typologies;
- different types of assets;
- specific property conditions;
- the type of transaction, rent or sale.
Following the evolution of property prices
Imagine you need to make predictions for the property prices in 2024, so you understand how to best advise your clients during the year. How would you look for such information inside Market Analytics?
Within CASAFARI’s Time Series feature, users can delve into the nuanced market behaviour specific to each asset type over time, providing invaluable insights into long-term shifts and trends within the real estate landscape.
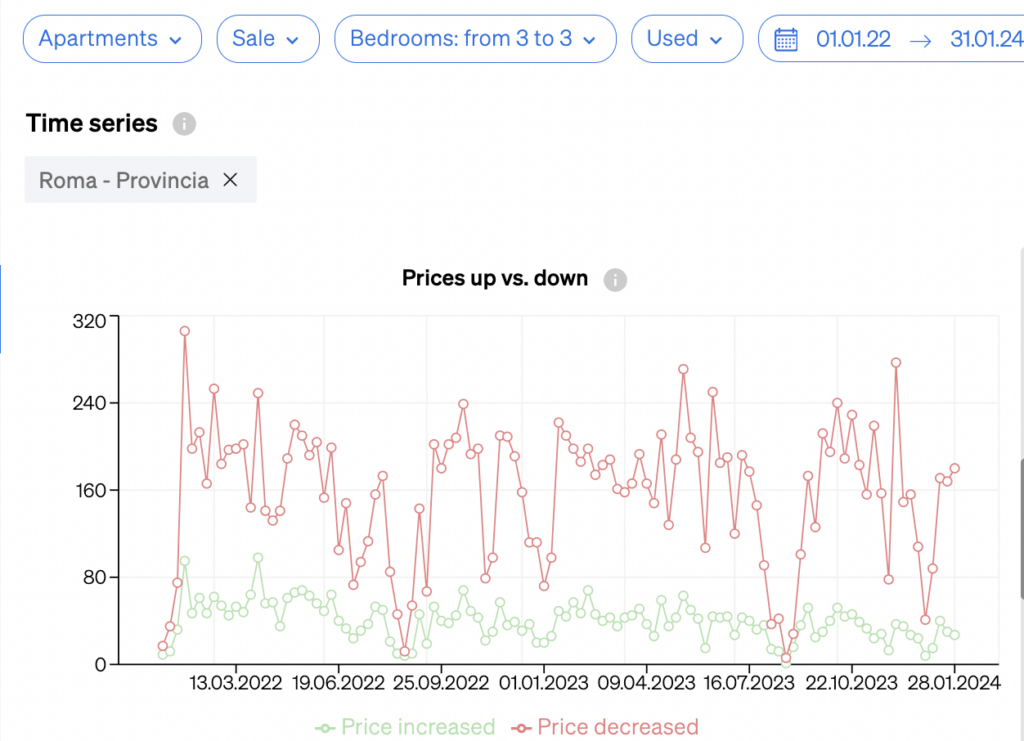
This section of Market Analytics offers detailed charts illustrating fluctuations in average asking prices and the number of properties experiencing increases or decreases in value, as well as by how much they are appreciating or depreciating.
This granular analysis proves particularly beneficial for individuals seeking to make informed investment decisions or advising clients willing to invest in real estate. By assessing which assets are on a trajectory of appreciation or depreciation, users can gain a comprehensive understanding of potential returns on investment.
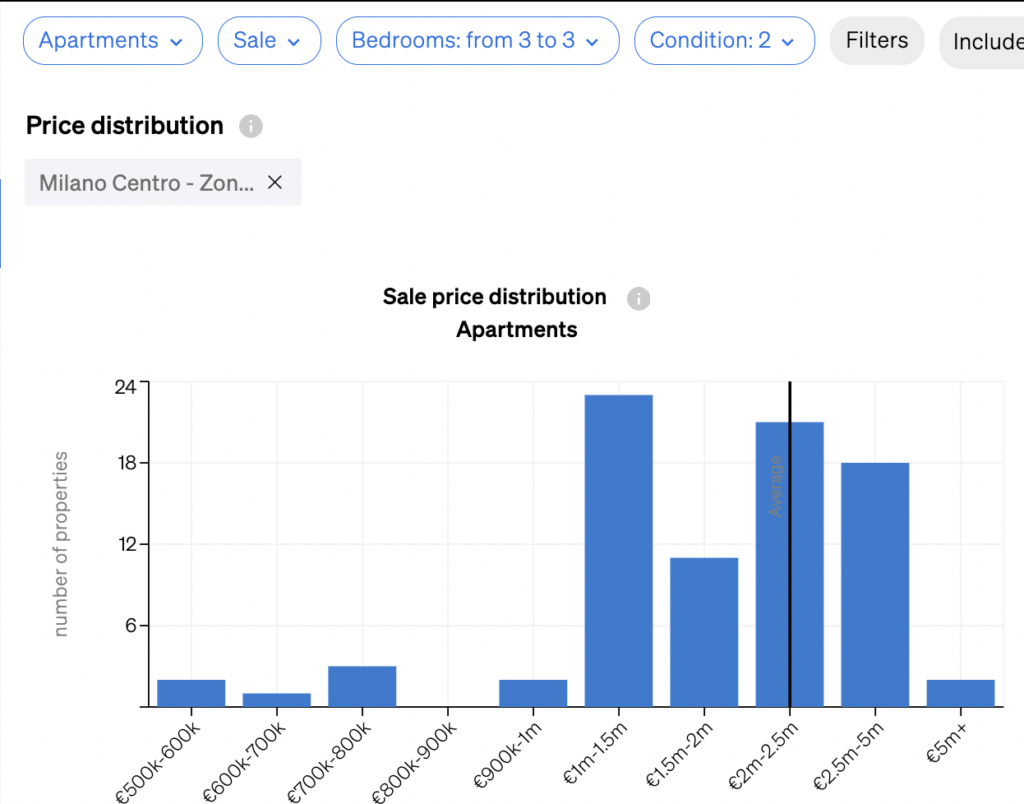
On the other hand, inside Price Distribution, another feature of Market Analytics, the charts show another interesting information: how are the assets distributed per price segment. Which means, you will be able to visualise what prices are most commonly practised for a specific asset type, as well as in which segments there is a greater or lesser stock.
Assessing market stock and demand
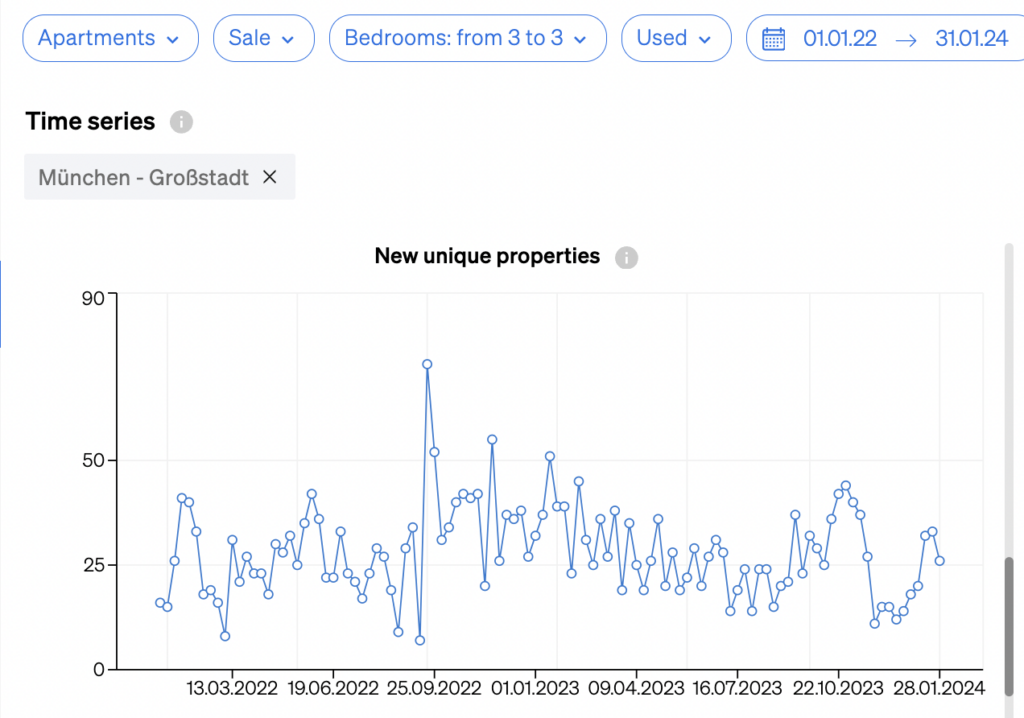
Within the Time Series feature of Market Analytics, it is also possible to assess stock movements, as well as charts showing the properties added to the market or sold. This helps professionals to view which locations in a city, district, or country are experiencing increased demand.
Also, this analysis yields valuable insights about which properties are more likely to maintain high occupancy rates when in rental or are prone to easy resale in the future or, similarly, identify regions with low demand, alerting to the potential difficulty in finding tenants or buyers.
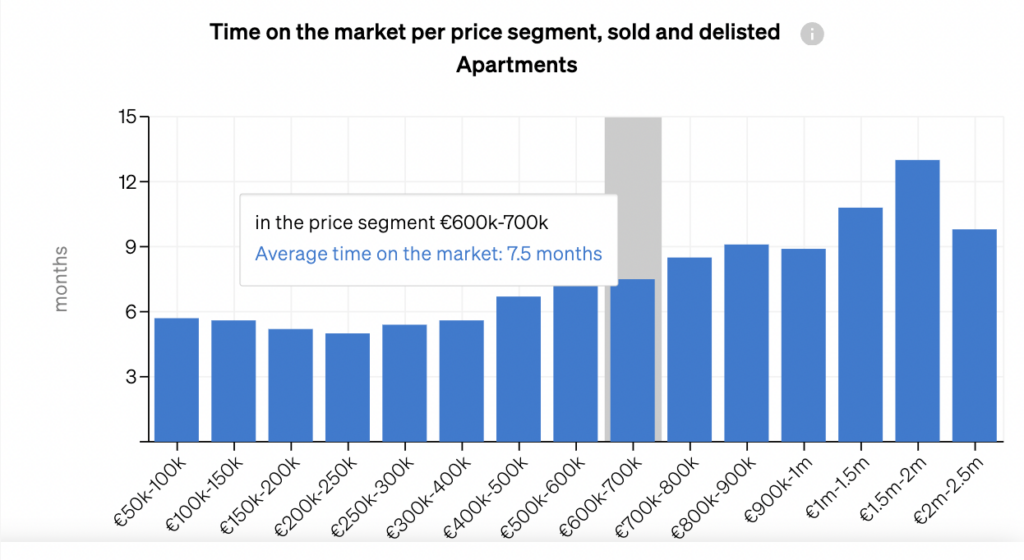
Whereas on Price Distribution, you can see how long properties spend on the market currently, according to their typology, asset class and price segment.
Meaning that, when comparing this data with the historical data you find on Time Series, you can find out which typologies and asset classes are becoming more or less attractive to potential buyers or tenants.
Understanding negotiation patterns
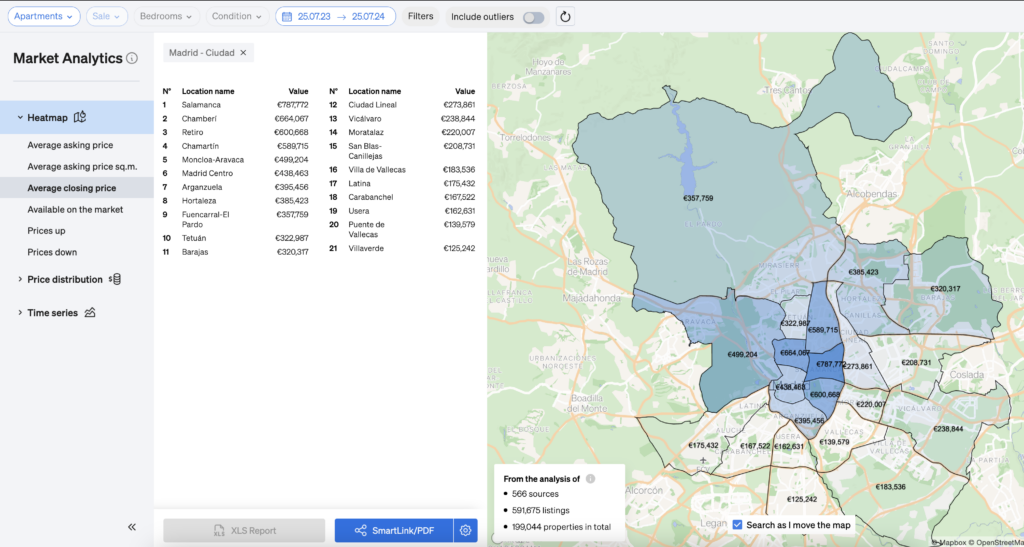
With our Heat Map, agents can see the average closing price for deals in specific areas. This allows real estate professionals to calculate the range between asking price and the final value of the sale, preparing their negotiation skills for both increasing and decreasing prices.
It also impacts pricings strategies in different areas of a city that one single professional might work with.
Start basing your property market predictions on more than experience and feeling: CASAFARI’s technology provides you with all the data you need to analyse the evolution of property prices, the demand for different assets in different markets and more.