CASAFARI Market Analytics is a product that boosts deals because it offers insights, through the use of artificial intelligence, to understand the property market trends. With this relevant information, you get to confidently negotiate in sale and rental deals, and are able to make strategic decisions for the real estate brokerage and investment.
Find out which are the main data provided in this tool and how the broker, the estate agent and the real estate investor can benefit from them.
Which information about the property market can you find in CASAFARI Market Analytics?
CASAFARI Market Analytics shows information about the property market trends based on a selected time frame and area. This means that this product has the power to offer a complete view of the market’s movements and local specificities, making a “zoom in” in those places that are relevant for the work of the real estate agent and on real estate brokerage in general.
You can pull many different analyses and understand based on how many sources, listings and properties they were made. Check all the information available in this product!
Stock availability and time on the market
How many properties are there for me to work with in this area of the city? Is the limited stock of properties the reason for higher prices in houses and apartments? To answer questions such as these, the real estate agent can check on CASAFARI Market Analytics how many properties are available in the market in a specific area and how many rooms do they have.
It’s also possible to check which is the average time they spend on the market, for rental and sale, per price range.
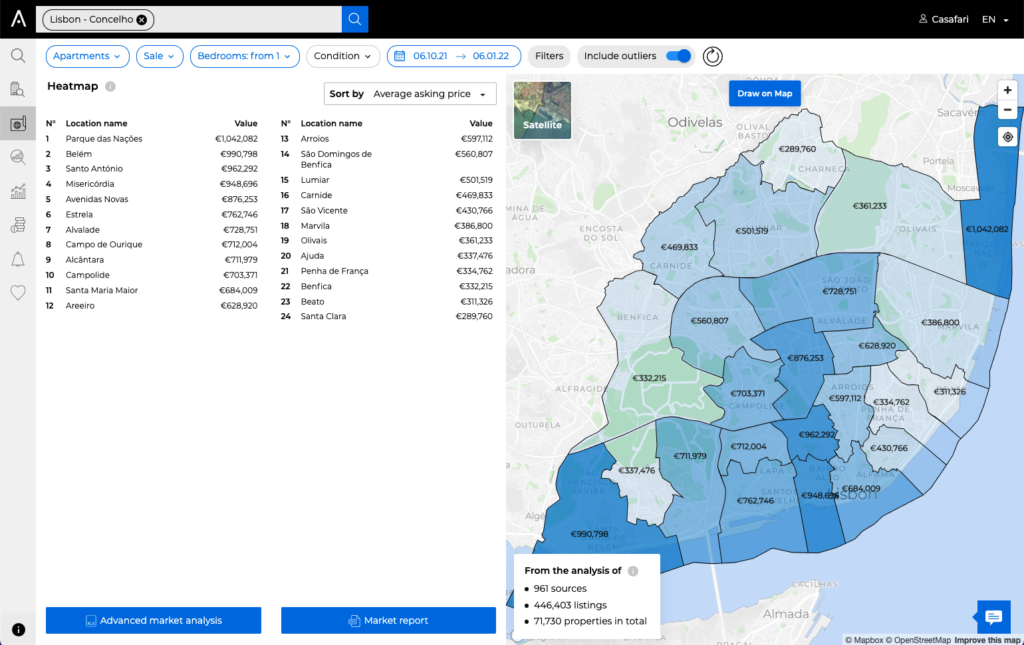
Property prices: a heat map with data per area, for sale and rental
CASAFARI Market Analytics’ heat map shows information about the property market trends in a simple and graphical way. Get access to data such as:
- The average price of properties in an area, for sale or rent, including information per square metre
- How many properties are there in an area that have had their prices raised or lowered
You can also choose to see figures only for houses or only for apartments by using our filters.
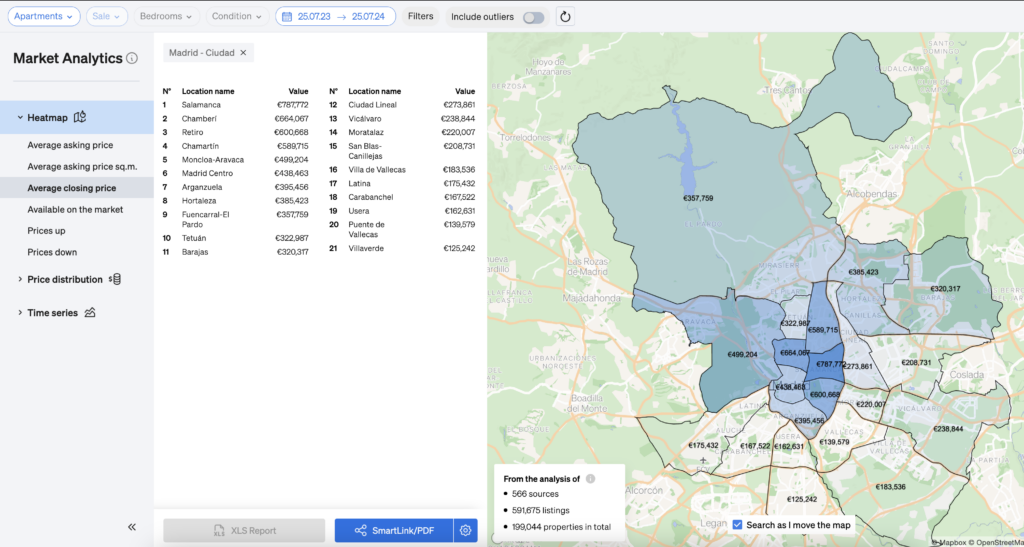
Closing prices: localised negotiation insights
Another one of the relevant pieces of information about the property market available on our Heatmap is the average closing prices. They are shown according to each area of the city, so professionals can change their pricing strategy according to how much the final transaction varies from the original asking price.
It’s also an indication of how much negotiation can be expected in a specific area and whether estate agents should be ready for increasing or decreasing values.
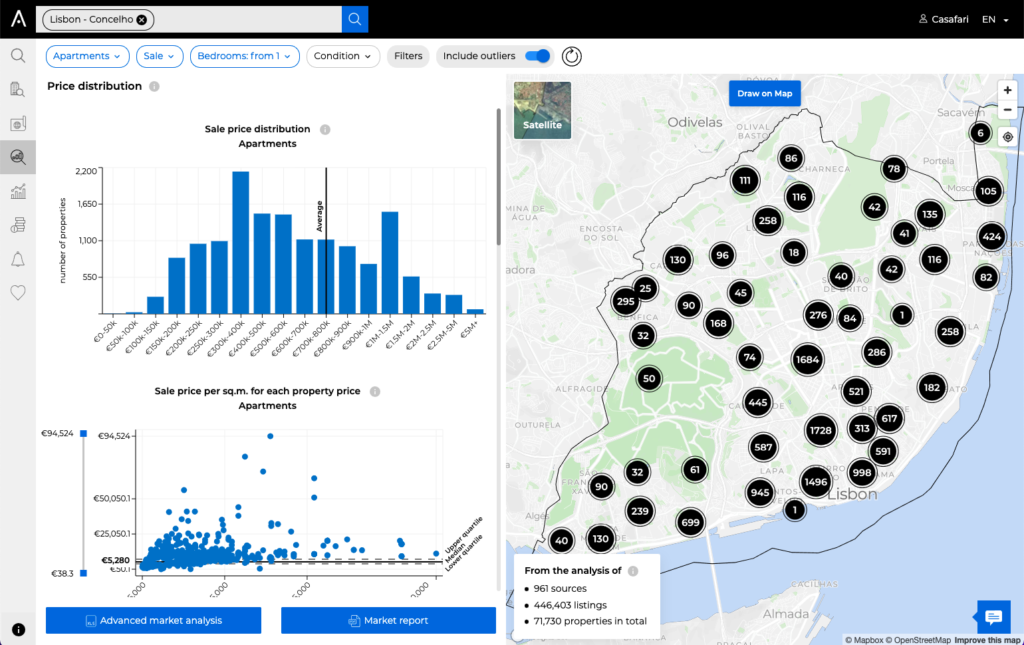
Distribution of properties by number of rooms and price range
The real estate agent knows that properties with different amounts of rooms and different price ranges can behave differently once on the market. For example: what is considered an acceptable price for a 3-bedroom luxurious apartment in a sought after area will certainly differ from another 3-bedroom in a less prestigious part of the city or in a smaller property.
With CASAFARI Market Analytics, you get access to information such as:
- How many properties are there on the market per price range
- How many properties are there on the market per price per square metre
- What is the average price charged per amount of rooms
- Which are the the property prices per square metre, according to the amount of rooms the property has
All this data can be seen both for houses and apartments.
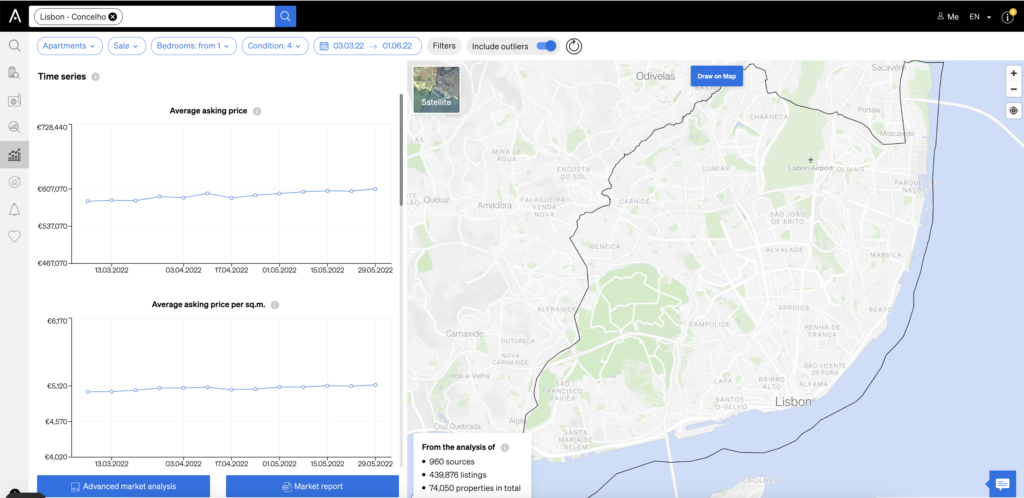
Time series: property market trends seen through time
The time series is a true property market analysis, in the sense that CASAFARI shows the trends of the real estate market through time.
On CASAFARI Market Analytics, when you select an area and a time frame to analyze, you’re able to see the following information:
- The rises and decrease of the average total prices and average property prices per square metre
- The number of rises vs. number of decreases of property prices in the market
- Amount of new properties on the market
- Amount of properties sold or removed from the market
Keep reading, we’ll speak further about how these data can be used on the day-today activities of real estate professionals.
How information on CASAFARI Market Analytics can be used by real estate professionals
By the owner of the agency, making strategic decisions for the business
The owner is responsible for making those decisions that are going to change the future of the real estate agency and increase its productivity. Therefore, they are going to need data that grants them a full perception of the market movements for informed decision-making.
When using CASAFARI Market Analytics, the owner of the agency will get to answer questions such as:
- Are there enough products/Is there enough demand on the market to open a real estate agency in a specific area?
- Is there an increase in supply or in demand in an area of the city where I work or to where I wish to expand my business?
- Are there promising places in the city, to where I could try to extend the real estate agents’ presence?
- Is there an imminent problem on the real estate market to which we should be prepared?
- Are there any increase or decrease trends in property prices through time in places where my company is present, that might affect my clients?
This way, it will be possible to define the distribution of real estate agents per area, find out where to recruit more professionals and where to open new agencies. Also, it’s possible to understand how to stimulate clients to buy a property when the price fluctuations are favorable and guide them on their best options when they’re not.
And last, but not least, the owner of the agency will be able to establish realistic goals for the business that can be updated according to the property market trends.
By real estate investors, gathering useful data for asset management
CASAFARI Market Analytics doesn’t show the property market trends only through a generic view: with this tool, real estate investors can sort information by asset class, condition of the property, amount of rooms and area. Therefore, they can check in details in which assets it is worth investing their capital.
Besides, the heat map allows visualizing in a fast and easy way the best areas to invest in a city, giving the real estate investor an idea of both the selling price of properties and the demand in these areas.
The combination of these pieces of data allow real estate investors to optimize their asset management, finding those properties that are gonna provide them higher yields.
By the real estate agent, convincing the client and closing deals faster
If the client questions the agent’s suggestions for the selling or rental price of a property, the professional can justify their choices and negotiate with the client using the information from CASAFARI Market Analytics.
He will be able to see data such as:
- Increases and decreases on property prices in an area
- The average price, according to the amount of rooms in the area in which the property is situated
- The amount of similar properties available at the market
And, to help in this task, you can also count on CASAFARI’s comparative market analysis, a tool that compares properties with similar characteristics and geographically close to obtain reliable estimates for selling and rental prices in seconds.