
Investing in real estate: find the most profitable locations with CASAFARI
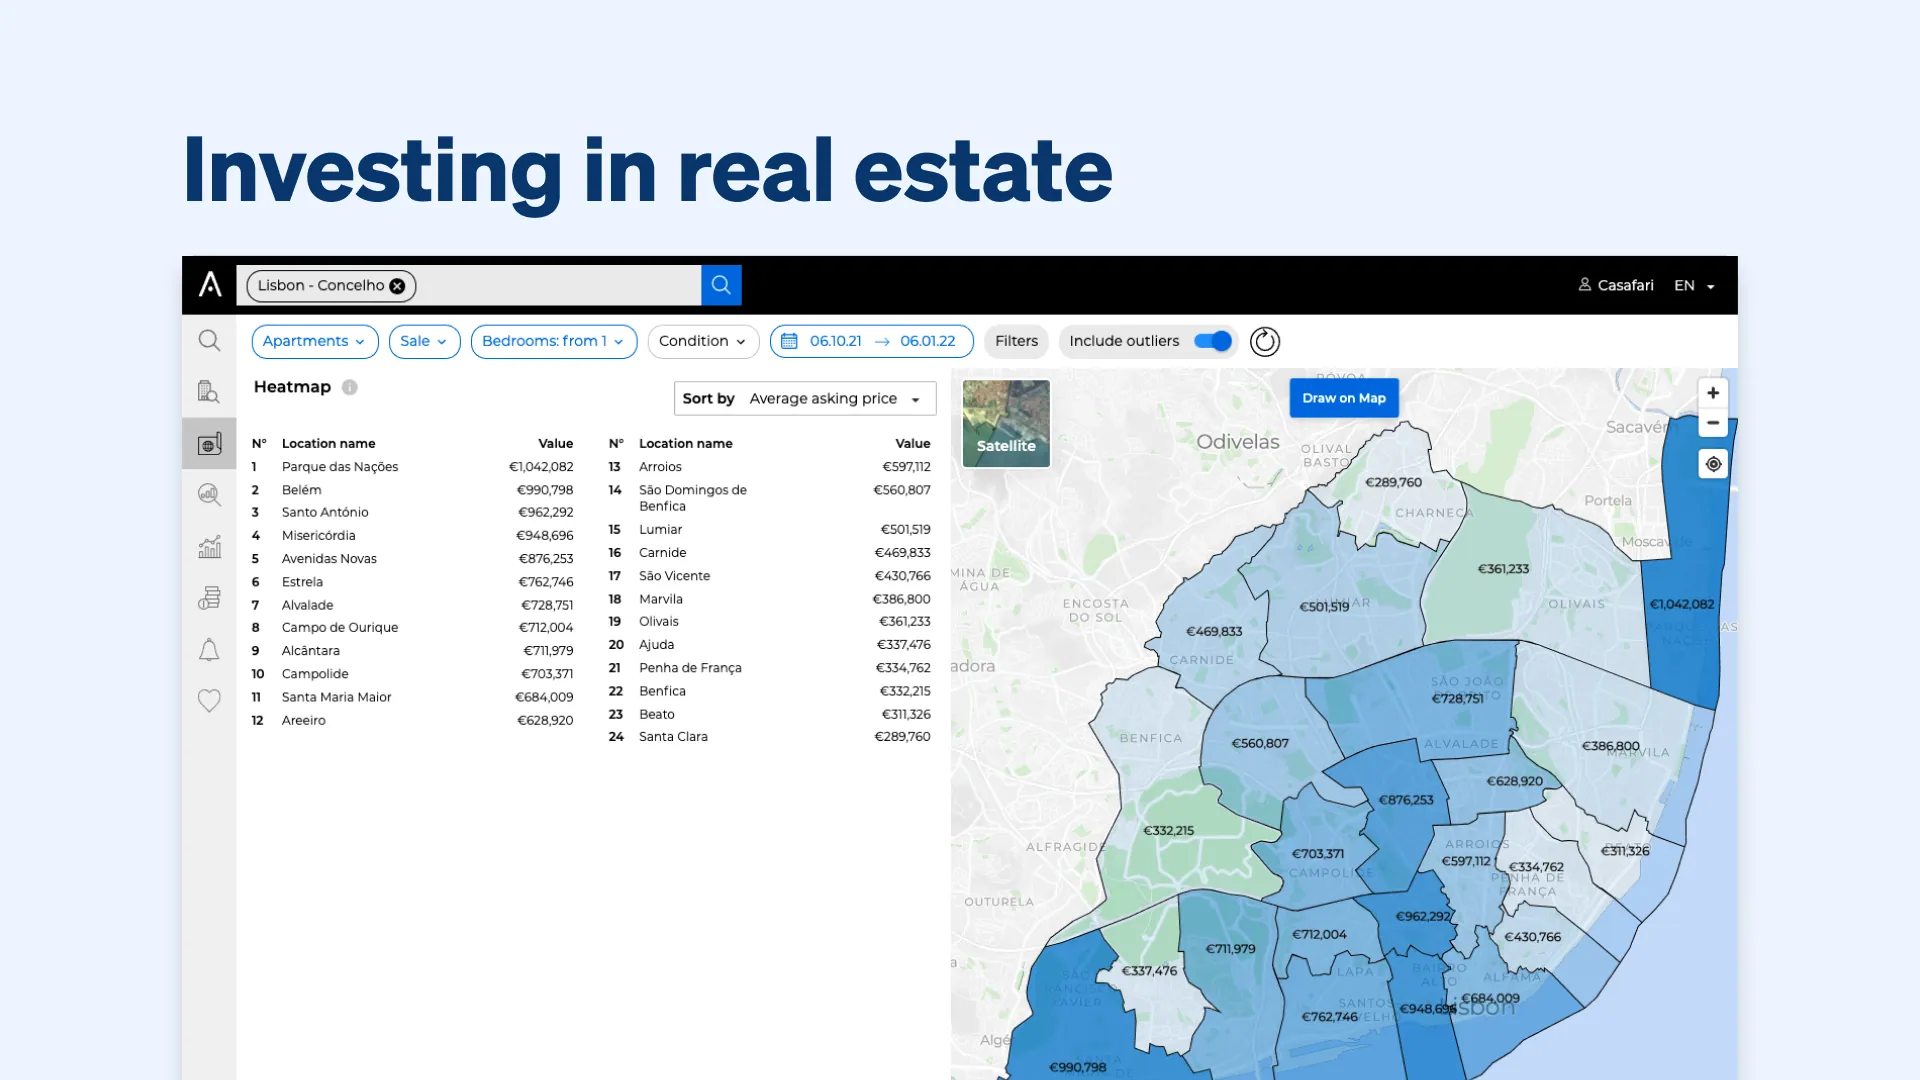
Real estate investors identify profitable property locations by analysing neighbourhood dynamics, proximity to essential amenities, and local market trends. CASAFARI supports capital deployment through Property Sourcing for calculating expected gross rental yields, Property Valuation to assess fair market value, local competition, time on market, and surrounding points of interest, and Market Analytics for tracking neighbourhood asking prices and supply through heatmaps and time series.
Which factors determine a profitable real estate investment location?
See a few factors that intersect to create the perfect place for a successful venture.
Neighbourhood dynamics
A neighbourhood’s social, economic, and cultural fabric can either bolster or hinder your investment’s potential. A thriving, safe and vibrant area often translates into higher property demand, increased rental income and a stronger appreciation in property values over time.
Conversely, an area facing economic decline, crime, or deteriorating infrastructure can spell trouble for real estate investments.
Proximity to amenities
Properties located near essential amenities such as schools, hospitals, public transportation, shopping centres, and recreational facilities tend to be more attractive to potential tenants and buyers. This convenience not only enhances the property’s marketability but also allows landlords to command higher rental rates and realise quicker turnovers.
Market trends
A keen understanding of current market conditions, such as supply and demand dynamics, interest rates, and economic indicators, can inform critical decisions like the timing of purchase or sale.
Moreover, staying attuned to emerging trends, such as shifts in consumer preferences or urbanisation patterns, allows investors to adapt their strategies and properties accordingly.
How do CASAFARI’s tools help investors evaluate property locations?
Property Sourcing: find the expected gross yields with rent
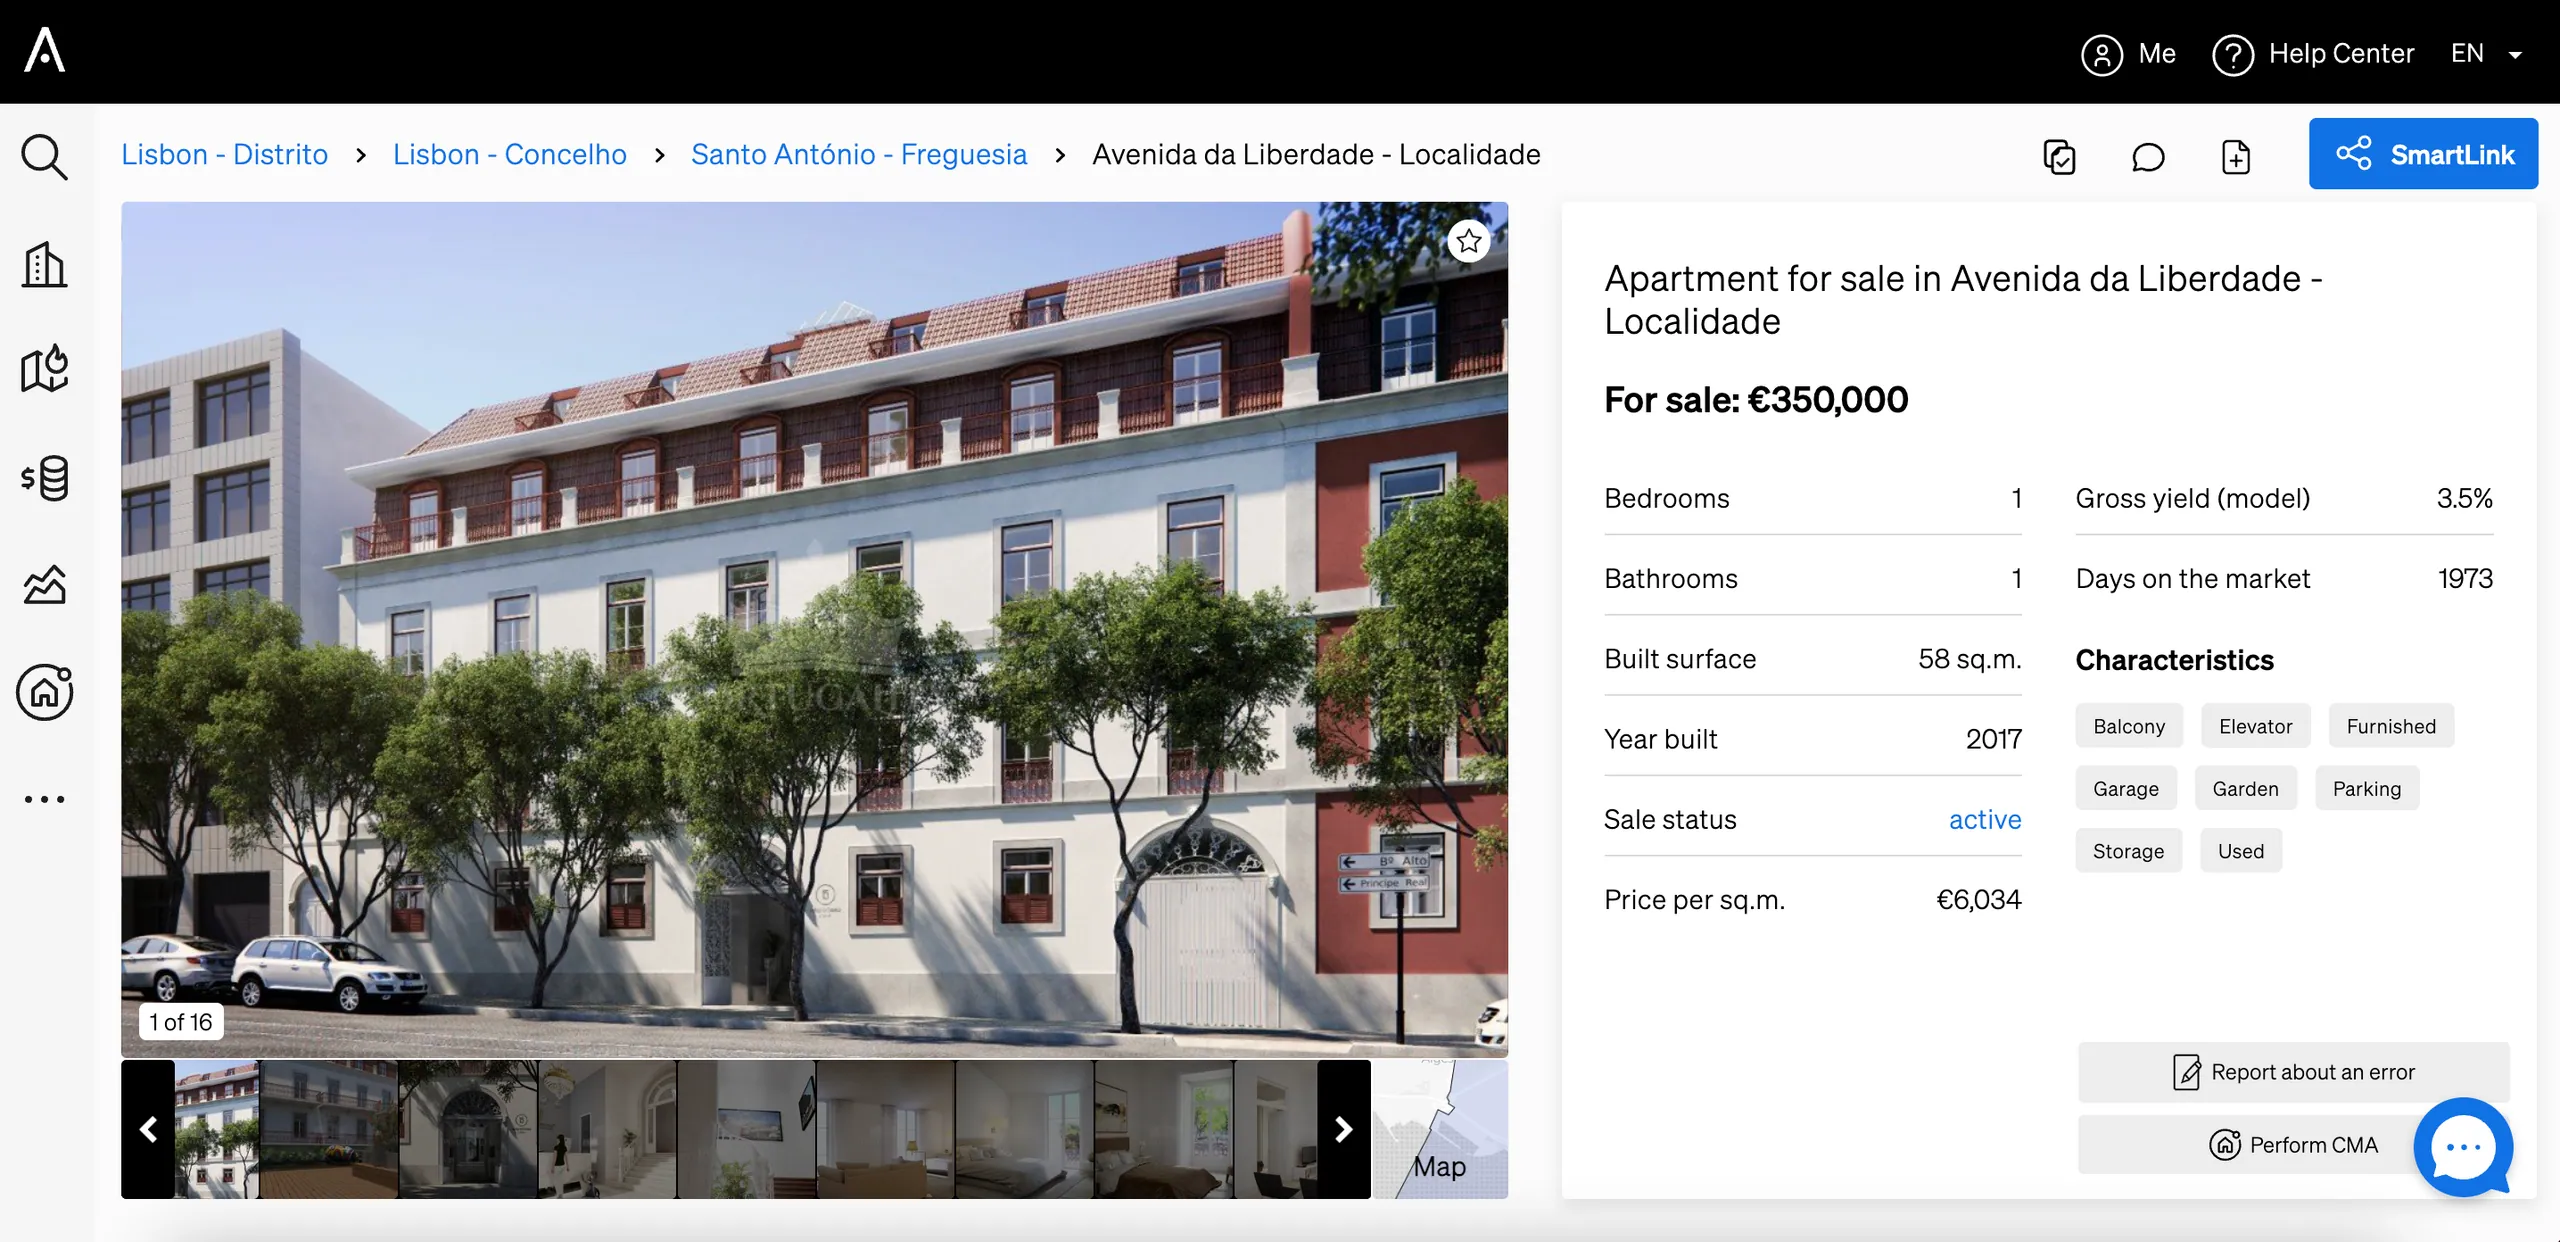
With CASAFARI’s Property Sourcing, real estate investors gain a valuable advantage by being able to access the expected gross yield for potential investment properties. This feature is based on an analysis of rents in the same location and similar properties, providing a clear estimate of the potential rental income a property can generate.
Having access to expected gross yields not only aids in assessing the property’s income-generating potential—such as when calculating rental yield with CASAFARI—but also allows investors to compare various properties in different locations and check if a specific real estate fits with their ROI expectations.
Property Valuation: fair market value and points of interest surrounding a property
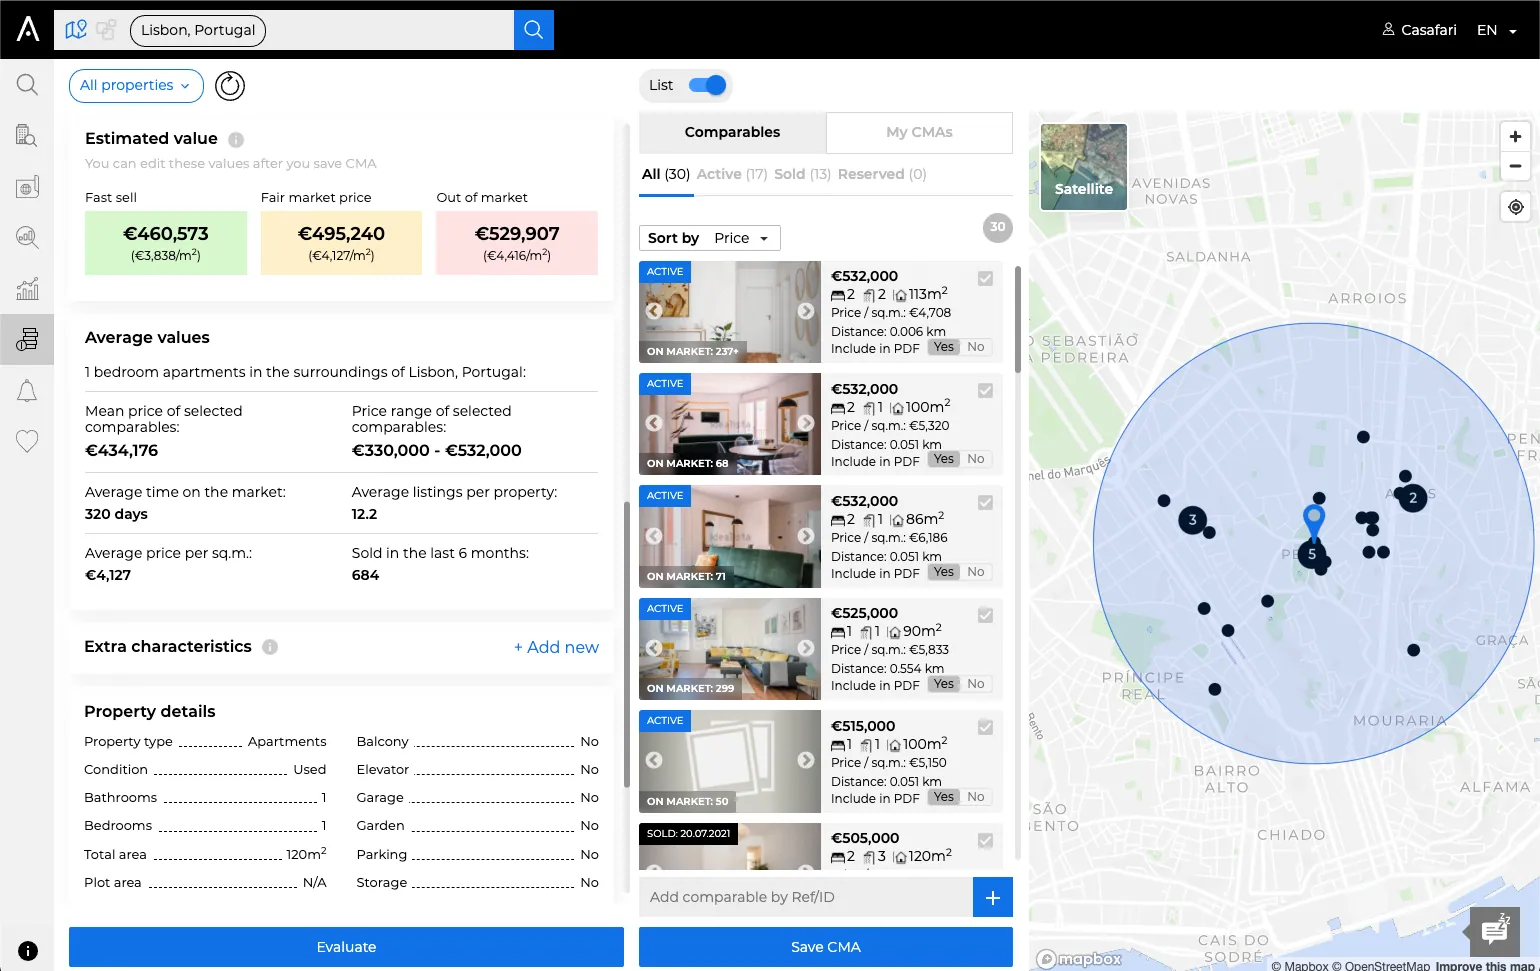
An important part of investing in real estate is the understanding of the competition in the local market: markets with higher competition will probably be harder to rent. On the other hand, if the demand for properties in an area is high, they will spend very little time on the market before new tenants present themselves.
So, before spending their capital on a property, real estate investors are able to run a property valuation inside CASAFARI to see relevant aspects of the real estate, such as:
- the fair market price of a property, for sale or rent;
- the average asking price per square metre of properties with similar characteristics and location;
- a list of its competitors on the market;
- the average time a property such as this spends on the market.
Another possibility inside CASAFARI’s Property Valuation is to add to your valuation report a list of the points of interest in the surroundings of the property. You can choose from information about transportation, hospitals, schools, pharmacies, parks and food, so you understand how the offer can impact on the asking price of the property.
Being a local expert as an estate agent: how CASAFARI helps you
Market Analytics: understanding the market per area
With Market Analytics and Area Insights, investors can see all the information they need to understand if investing in real estate in a certain area of the city might be a good idea.
In our heatmap, they can decide for a location, which kind of properties they want to see information about, a typology, a type of business (rent or sale) and a time period. After their criteria is set, real estate investors are presented with the average asking price per square metre in each neighbourhood, as well as how many properties are available per area and how many increases or decreases in asking prices each location went through.
Also, looking at our time series (detailed in the Area Insights API documentation), the appreciation or depreciation of properties can be observed through time, along with graphs for the new properties added to the market or the ones that have been sold and delisted.
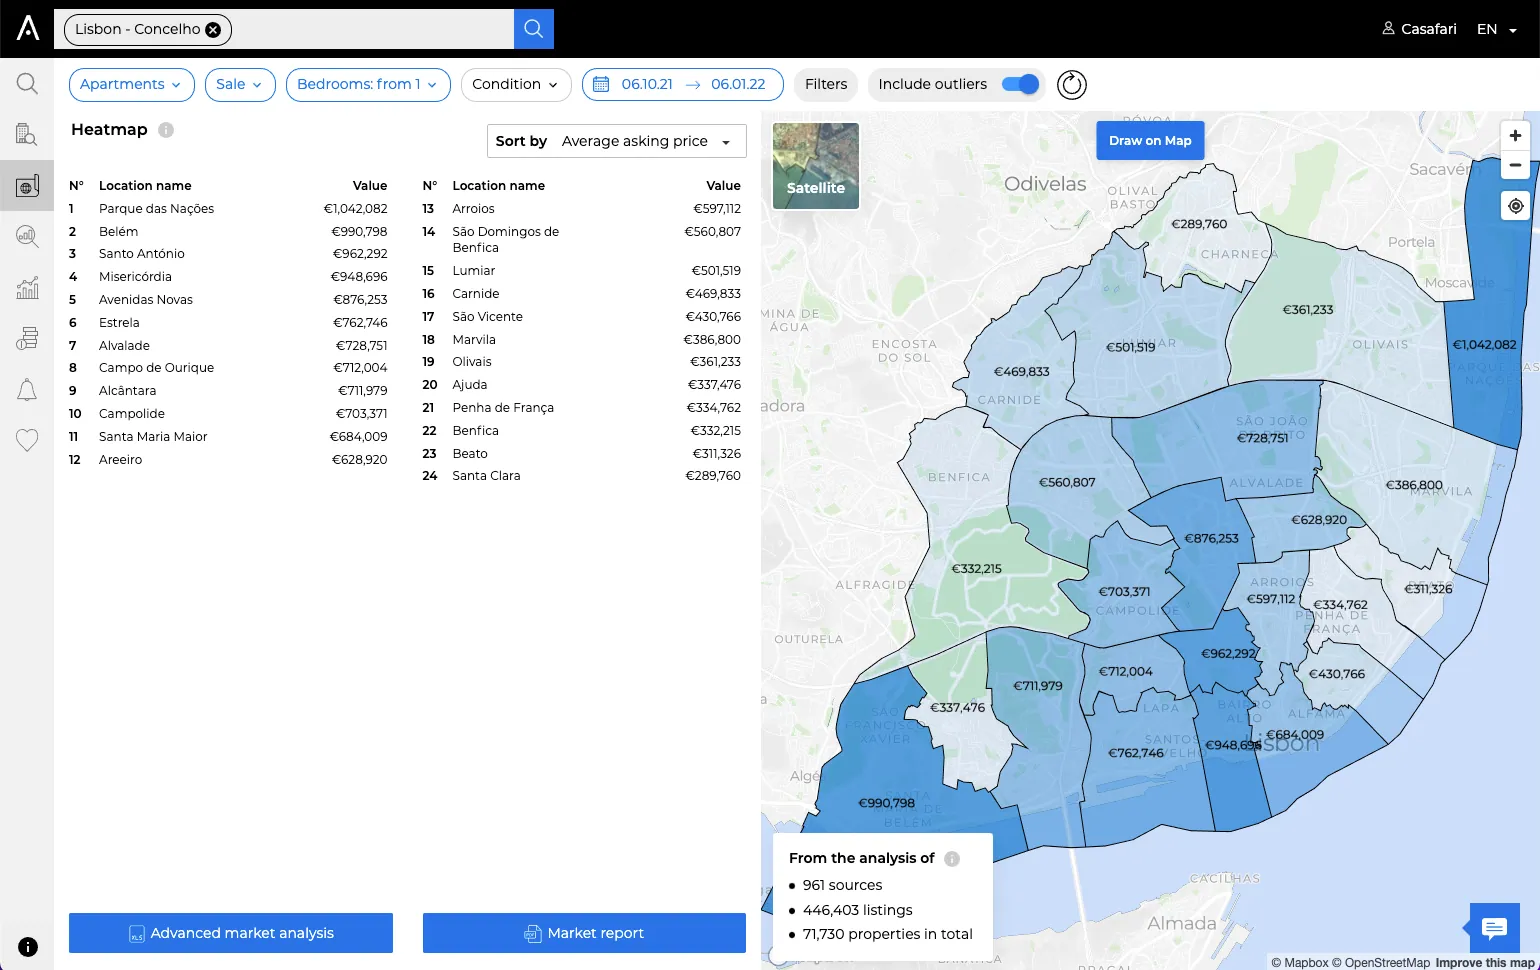
With the right data set, you can understand the property market scenario, making investing in real estate a reliable business. Subscribe to CASAFARI and start using technology in favour of your profitability.
Frequently asked questions
How does CASAFARI calculate the expected gross rental yield of a property?
CASAFARI’s Property Sourcing analyses the asking rents of similar properties in the same location to estimate the potential rental income a property can generate. This enables real estate investors to compare assets across different locations against their ROI expectations.
What information does a CASAFARI property valuation report provide to investors?
A CASAFARI property valuation report details the fair market value for sale or rent alongside the average asking price per square metre of comparable properties in the area. It also displays active competing listings, average time similar properties spend on the market, and surrounding points of interest.
Which points of interest can be included in a CASAFARI valuation report?
Investors can choose to include surrounding points of interest such as public transport links, hospitals, schools, pharmacies, parks, and dining options. These amenities help investors assess how local infrastructure affects asking prices and tenant demand.
How do Market Analytics heatmaps and time series help evaluate a neighbourhood?
After filtering by location, property type, typology, transaction type, and period, the heatmap displays average asking prices per square metre, available stock, and asking price changes per neighbourhood. Time series graphs then track property appreciation or depreciation alongside new, sold, and delisted listings over time.
Why does time on the market matter when choosing an investment location?
Time on market reflects tenant and buyer demand versus local competition. Areas with high competition make properties harder to rent or sell, whereas locations with strong demand see properties spend very little time on the market before being let or sold.