
Gross rental yields in European cities 2026: 35 cities in five countries compared
Across 35 cities in Portugal, Spain, Italy, France and Germany, gross asking yields on residential apartments in Q3 2026 range from 3.91% in Munich and Hamburg to 6.76% in Naples among stable markets. Data queried from Area Insights for July to September 2026 shows that country-level policy and pricing dynamics create wider yield spreads between nations than between cities within the same border.
Imagine an investor with a budget of EUR 400,000 looking for a residential buy-to-let asset in Western Europe. In Munich, where asking prices averaged EUR 8,769.92 per square metre in Q3 2026, that sum secures a 45.6 square metre apartment asking EUR 1,305 in monthly rent. In Coimbra, Portugal, where asking prices averaged EUR 2,898.18 per square metre in the same quarter, EUR 400,000 buys a 138 square metre property asking EUR 2,230 a month. The initial capital outlay is identical, yet the headline revenue differs by nearly EUR 1,000 every month.
To make clear comparisons across markets, every figure in this analysis follows one methodology: the average asking rent per square metre multiplied by 12, divided by the average asking sale price per square metre for residential apartments. The data is pulled directly from active portal and agency listings aggregated by CASAFARI in Q3 2026, with statistical outliers excluded. These are gross asking metrics—not transaction prices, signed lease amounts, or net yields.
Gross rental yields in 35 European cities, Q3 2026: the table
When calculating unweighted averages across the sampled cities in each nation, Italy leads with a country-level gross asking yield average of 6.97%, followed by Spain at 6.41%, Portugal at 5.91%, France at 5.68%, and Germany at 4.52%. However, examining individual urban centers reveals significant local nuances.
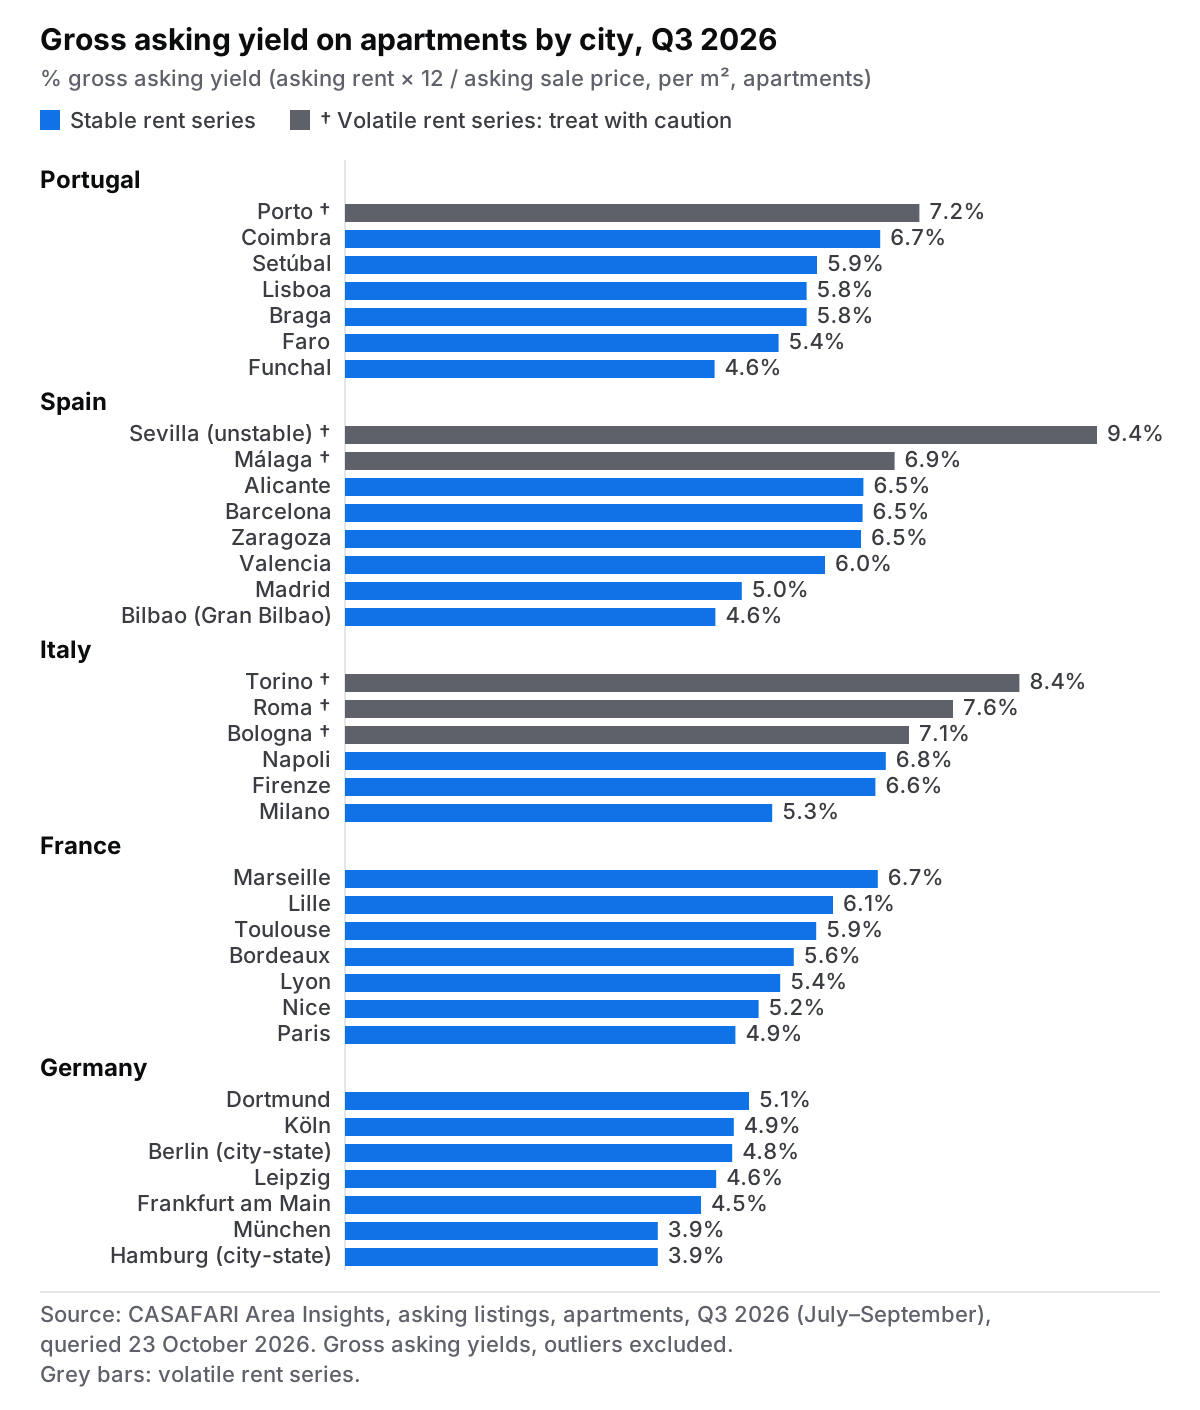
Among cities with stable time series, the highest gross asking yields in Q3 2026 are found in Naples (6.76%), Coimbra (6.69%), Marseille (6.66%), Florence (6.63%), Alicante (6.48%), Barcelona (6.47%), and Zaragoza (6.45%). At the lower end of the spectrum sit German financial and industrial hubs alongside prime resort destinations: Munich and Hamburg both record 3.91%, Frankfurt am Main sits at 4.45%, Funchal at 4.62%, and Bilbao at 4.63%.
Several cities exhibit elevated quarterly volatility in their rental listing data, where quarter-on-quarter asking rent swings exceeded 15%. Seville shows a gross asking yield of 9.4% and Turin records 8.43%, but both figures reflect unstable listing counts and should not be used in formal market rankings. Similarly, Porto (7.18%), Málaga (6.87%), Rome (7.60%), and Bologna (7.05%) show volatile quarterly rent movements and must be interpreted as broad directional ranges rather than precise figures.
In terms of spatial definition, Berlin and Hamburg are measured as city-states (Bundesland administrative regions), Gran Bilbao covers the metropolitan zone, and Seville reflects the ‘Seville capital’ region.
Why Italy and Spain yield more than Germany and France
A high headline rent does not guarantee a high yield. Paris commands the highest average asking rent in the 35-city dataset at EUR 48.07 per square metre per month in Q3 2026. However, because its average asking sale price stands at EUR 11,818.46 per square metre, Paris generates a modest gross asking yield of 4.88%.
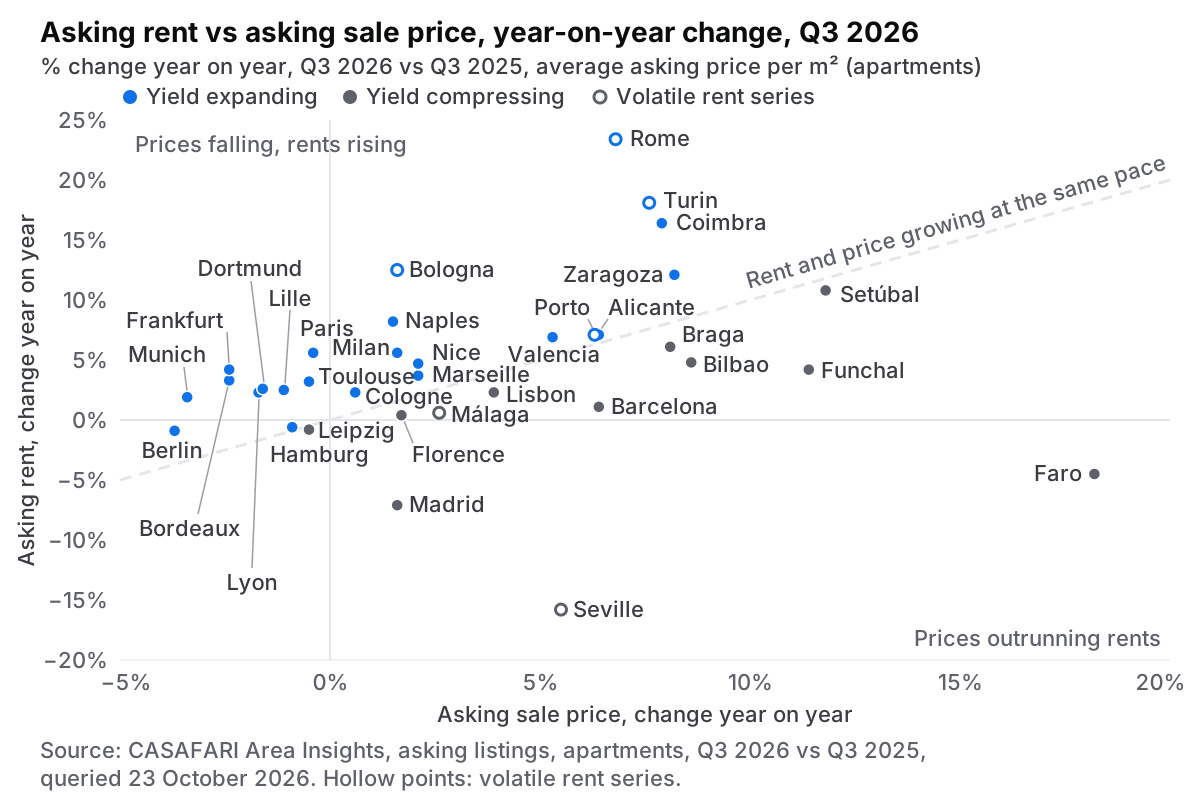
In Germany, capital values have continued to adjust downwards year-on-year across major cities—Berlin asking prices fell 3.7%, Munich dropped 3.4%, and Frankfurt decreased 2.4%—while asking rents remained largely flat or grew marginally. As a result, German gross yields remain compressed below 5%, though they are slowly widening from the price side.
In France, property sale prices in Paris (-0.4%), Lyon (-1.7%), Bordeaux (-2.4%), Lille (-1.1%), and Toulouse (-0.5%) experienced mild annual declines while asking rents grew between 2% and 6%. This dynamic has allowed French yields to recover slightly, with industrial and coastal regional hubs like Marseille (6.66%) and Lille (6.10%) outperforming the capital.
Italian cities deliver higher gross yields primarily due to lower entry prices per square metre relative to prevailing rents. Turin (EUR 2,225.87 per square metre) and Naples (EUR 3,108.51 per square metre) offer accessible entry points alongside robust tenant demand.
Spain presents stark contrasts between its prime economic engines. Barcelona recorded a gross asking yield of 6.47% in Q3 2026, whereas Madrid yielded 4.96%. In Madrid, average asking rents dropped 7.1% year-on-year (and 12.6% over two consecutive quarters) while asking sale prices edged up 1.6% to EUR 6,895.28 per square metre, squeezing gross margins.
In Portugal, major urban markets cluster closely between 5.4% and 5.9%, including Lisbon (5.77%), Braga (5.77%), Setúbal (5.90%), and Faro (5.42%). Faro provides a clear example of yield compression driven by asset appreciation: average asking sale prices jumped 18.2% year-on-year while asking rents fell 4.5%.
To explore historical rent and price trends across these markets, institutional investors can query full quarterly data through Area Insights.
Gross yield, net yield, and what sits in between
To evaluate residential acquisitions effectively, investors must distinguish between four distinct yield definitions. Gross asking yield measures annualized asking rent against asking sale price. Gross achieved yield replaces asking metrics with verified transaction prices and signed lease agreements.
Net rental yield accounts for all non-recoverable operational costs and transaction fees associated with the property before accounting for debt service or income taxes. Cash-on-cash yield evaluates the net annual cash flow relative to the actual equity invested after deducting mortgage interest and principal payments.
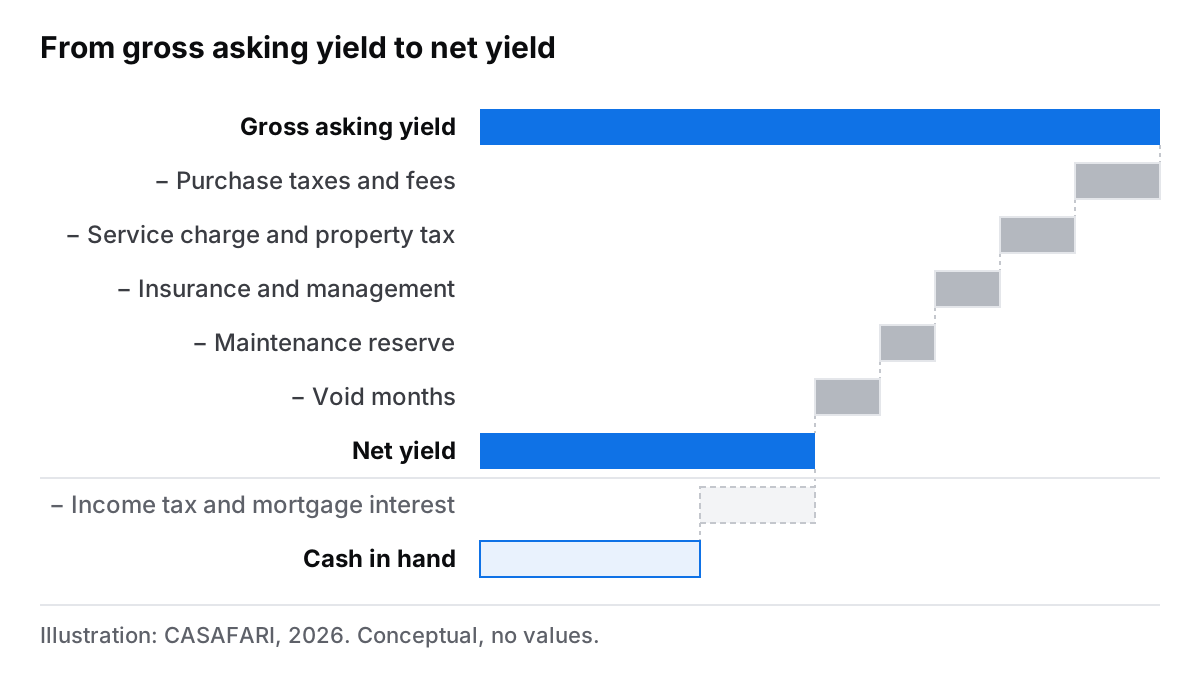
Consider the worked example for Lisbon in Q3 2026. A standard 70 square metre apartment at average city prices (EUR 6,130.39 per square metre) represents an asking price of EUR 429,127. At average asking rents (EUR 29.47 per square metre per month), the annual gross rental income equals EUR 24,755, producing a gross asking yield of 5.77%.
To derive the net yield from this 5.77% starting point, an investor must subtract non-recoverable expense categories:
- Upfront acquisition friction: Amortised property transfer taxes, notary fees, legal costs, and land registry charges.
- Ownership and property taxes: Local municipal taxes such as IMI in Portugal, IBI in Spain, taxe foncière in France, IMU in Italy, or Grundsteuer in Germany.
- Property maintenance and management: Condominium or service charges, structural maintenance reserves, building insurance, and professional lettings agency fees.
- Occupancy friction: Factoring in potential void periods between tenancies.
Across Southern and Western European residential markets, net yields typically land between 1.5 and 2.5 percentage points below gross asking figures once purchase friction and operational costs are fully factored in.
How to check a yield before you buy: a five-step routine
Before making an investment decision, institutional buyers and advisory teams should perform a structured five-step validation process:
- Refine geographic boundaries: City-wide averages provide broad directional context but hide street-level variance. Evaluate data at the specific parish, neighbourhood (barrio), or district (Bezirk) level using Valuation & Market Study.
- Audit time series volatility: Check whether rental series exhibit sharp quarterly swings above 15%, which usually signal low listing sample sizes. Review how CASAFARI excludes outliers to ensure baseline data integrity.
- Cross-reference asking prices with true closures: Validate seller expectations by comparing listing asking prices against registered sales and land registry data using transaction data to test an asking price.
- Analyze active rental liquidity: Assess average time-on-market for rental property listings, monitoring withdrawn listings and price reductions. Madrid’s 12.6% rental asking price correction over two quarters illustrates why tracking active asking price adjustments is vital.
- Model net cash flow and local regulatory caps: Incorporate local tax rates and statutory rent caps into your financial underwriting.
Developers and data teams can automate these five steps programmatically. Full time series endpoints are documented in the Area Insights API documentation (in English). To obtain credentials and manage query allocation, visit the CASAFARI platform, where you can sign in and get an API key. Note that API queries consume accounts tokens based on request volume.
Rent rules and taxes that change the answer, country by country
Statutory rent controls significantly alter achievable income depending on the jurisdiction:
- Germany: The Bundestag extended the Mietpreisbremse (rent brake) through 31 December 2029. In designated tight housing markets—which include Berlin, Munich, Hamburg, Frankfurt, and Cologne—re-letting rents cannot exceed the local comparative index (Mietspiegel) by more than 10%, except for new builds or comprehensively renovated properties. See the Bundestag’s extension of the Mietpreisbremse to 2029.
- France: Under the encadrement des loyers framework operating in Paris, Lyon, Lille, Bordeaux, and other major centers, new rents are capped relative to a reference benchmark plus 20%. The experimental scheme was scheduled to expire on 24 November 2026, with parliamentary proposals for extension under review; consult the debate on extending Paris’s encadrement des loyers.
- Spain: State housing laws (Ley 12/2023 por el derecho a la vivienda) allow regional authorities to declare designated zonas de mercado residencial tensionado. In these zones, new lease prices are capped by reference price indexes. Catalonia had declared 271 municipalities as tense zones by October 2024, including Barcelona; review the BOE declaration of Catalonia’s 271 tense-market municipalities. The Community of Madrid has opted not to declare any tense zones.
- Italy and Portugal: Leases in Italy operate under standard free-market framework terms or agreed-rent schemes (canone concordato). In Portugal, residential tenancies are governed by the NRAU regime. Investors should consult national tax authorities regarding exact tax filing obligations.
- Transaction costs: Purchase friction across these five European nations generally adds between 2% and 13% to the purchase price in taxes, notary, and administrative costs.
For investors planning cross-border portfolio allocation, explore CASAFARI for Business Expansion across the five countries or review our guide on why rental yield matters and where to find it in CASAFARI.
Where the figures come from and how to get the same data
CASAFARI aggregates and deduplicates millions of property listings from thousands of portal and agency sources across Southern and Western Europe. Through Area Insights, users can access clean quarterly time series metrics for average asking price per square metre (avg_price_psqm) across both sale and rental listings.
To extract matching datasets, query locations using standard municipal boundaries or regional identifiers via Location Lookup. In the CASAFARI web platform, these analytics can be analyzed directly within the time series tool in Market Analytics. For wider strategic selection, read our analysis on finding the most profitable locations with data.
Headline rental yield metrics serve as an initial screening filter. Successful cross-border investing ultimately depends on verifying local tenancy laws, realistic net income projections, and neighborhood-level tenant demand.
Frequently asked questions
Which European city has the highest rental yield in 2026?
Among European cities with stable rental listing counts in CASAFARI’s Q3 2026 dataset, Naples (6.76%), Coimbra (6.69%), and Marseille (6.66%) offer the highest gross asking yields on residential apartments. While Seville displays a headline figure of 9.4% and Turin records 8.43%, both rental time series exhibited quarterly swings exceeding 15% and are classified as volatile rather than benchmark rankings. All figures reflect gross asking metrics calculated before operational costs and taxes.
What is a good gross rental yield in Europe?
Across major Western and Southern European cities in Q3 2026, stable gross asking yields generally range between 3.9% and 6.8%. German metropolitan markets like Munich and Hamburg anchor the lower end around 3.91%, whereas regional markets in Italy and Spain frequently exceed 6.0%. A gross yield above 6.5% in a primary city represents a strong market baseline, though investors must evaluate local statutory rent caps to determine the achievable net return.
How do I work out net rental yield from gross?
To calculate net rental yield, take the total annual gross rent and subtract non-recoverable operational expenses including property taxes, service charges, maintenance reserves, management fees, property insurance, and an allowance for vacancies. Divide this net annual operating income by the total acquisition cost, which includes the property purchase price plus all upfront taxes, legal, and notary fees. For instance, a 5.77% gross asking yield in Lisbon typically converts to a net yield 1.5 to 2.5 percentage points lower.
Is Lisbon or Madrid the better buy-to-let market in 2026?
On Q3 2026 asking data, Lisbon presents a higher gross asking yield at 5.77% compared to Madrid’s 4.96%. Madrid’s average asking price per square metre (EUR 6,895.28) is higher than Lisbon’s (EUR 6,130.39), while Madrid asking rents fell 7.1% year-on-year compared to a 2.3% increase in Lisbon. Neither city enforces strict local rent caps on new residential leases at present, making net operational underwriting and localized capital growth expectations the decisive factors.
Are rents capped in Berlin, Paris and Barcelona?
Yes, all three cities operate under statutory rent restrictions. Berlin is subject to Germany’s Mietpreisbremse, extended by the Bundestag through 2029, which limits new tenancy rents relative to local reference benchmarks. Paris enforces the encadrement des loyers framework capping new leases at reference rents plus 20%, while Barcelona is designated as a tense housing market under Spain’s Ley 12/2023. Investors should note that active asking rents on portal listings may exceed legal statutory limits.